The 2023 Stock Trader’s Almanac has been published. This annual book has a tremendous amount of statistical data about the US stock market. One of the sections in this year’s edition is titled “Why a 50% Gain in the Dow is Possible from its 2022 Low to its 2023 High”. The article details the actions of the Dow Jones Industrial Average (DJI) during a US mid-term election year and subsequently into the next year.
For the benefit of this sites followers outside of the US – a brief explanation of the US Presidential cycle. Every four years in early November elections are held for the US President, all members of the US House of Representatives and one third of the US Senators. Two years after the Presidential election are the mid – term elections, also held in early November. The mid – term elections are for all members of the US House of Representatives and one third of the US Senators. This years mid- term election is Tuesday November 8th .
The almanac’s studied the percentage change of the DJI between the mid-term year low and the high in the following year. The study examined all mid – term elections from 1914 to 2018, that’s 27 elections. The average gain for the DJI after the mid – term year low into the next year was an astonishing 46.8%!
Every year after the mid – term year low the DJI had a gain going into the next year high. The smallest gain after a mid-term year low was 14.5% in 1947 after the 1946 mid -term low.
What about the worst bear market in US history, 1929 to 1932 when the DJI declined 89%? The mid – term election was in 1930, the low for that year came after the November election, bottoming in December. The high in the next year 1931 came in February with a DJI gain of 23.4%.
How often does the mid- term year low come after the mid – term election? This has occurred only three times, December 1930, December 1974, and December 2018. That’s 3 out of 27 or 11%. This statistic alone tells us there’s a high probability the DJI 2022 low could already be in place.
The Almanac used data from the DJI because it’s the oldest US stock index. While the DJI is a good index to use for analyzing Elliott waves and Fibonacci relationships, the S&P 500 (SPX) is better. The following three SPX charts courtesy of Trading View illustrate additional evidence that 2022 low for US stocks may have been made in October.
The daily chart shows the short-term view.
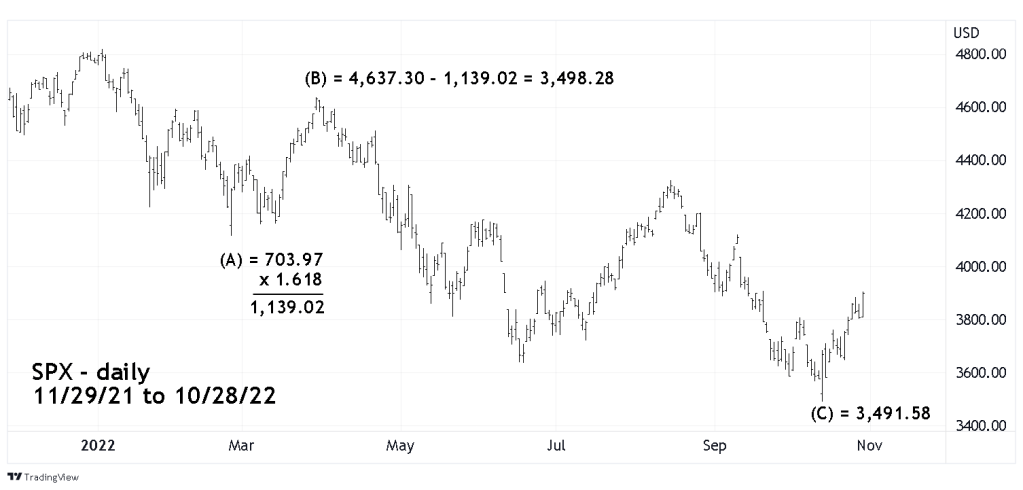
Several blogs on this site have noted the choppy SPX decline from January 2022 to October. Choppy movements are the signature of corrections to the main trend.
There are several different Elliott wave interpretation for the drop. A common Fibonacci relationship in Single or Double Zigzag corrections is a .618 relationship between the first wave and the third wave (A to C). In the case of a Double Zigzag, the first Zigzag is related by .618 to the second Zigzag.
For the sake clarity the SPX January to October decline is illustrated as a Single Zigzag. Note that the target for the presumed Intermediate wave (C) 3,498.28 is close to the actual bottom of 3,491.58.
The weekly chart shows the intermediate – term view.

The SPX October bottom came close to a Fibonacci .50 retracement of the bull move from March 2020 to January 2022. Also, the blog “ Fascinating Fibonacci Price and Time Relationships – 10/14/22” noted that the October SPX bottom was near a downward Fibonacci 1.236 extension of the June to August 2022 rally. This Fibonacci target was 3,474.41, close to the actual bottom of 3,491.58.
Three close Fibonacci coordinates represent powerful support and implies the October 2022 bottom could hold for at least several months.
The monthly chart illustrates the long-term view and some mind-boggling Fibonacci relationships.
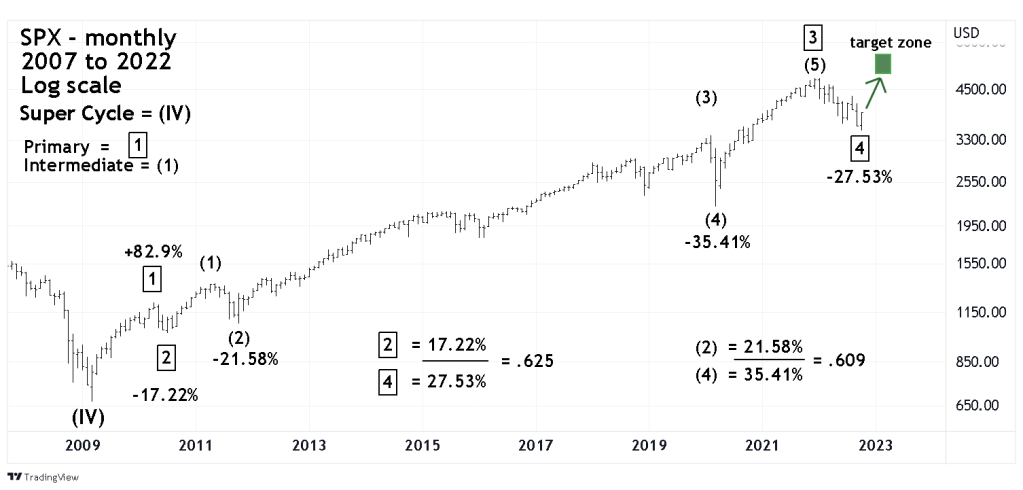
A common Fibonacci relationship between wave “two” and “four” within motive waves is .618. The Fibonacci relationships between the percentage declines of the presumed Primary wave “2” and “4” is .625 close to the golden Fibonacci ratio of .618. The same for the presumed Intermediate waves (2) and (4) which is .609 – amazing!
The January to October 2022 decline was nine months. While this is longer than either of the Primary or Intermediate degree corrections, the 2022 drop nearly matches a lower degree correction within the post March 2009 bull move. The SPX – May 2015 to February 2016 correction was nine months or 184 – trading days vs. 195 – trading day decline in 2022.
When making Fibonacci projections after a large percentage price movement its best to compare growth rates. There are usually Fibonacci relationships between waves “one” and “five” of motive patterns.
The presumed Primary wave “1” had a growth rate of 82.9% multiplying by the Fibonacci ratio of .50 is a growth rate 41.45% added to the October 2022 bottom at 3,491.58 targets SPX 4,938 as a potential Primary wave “5” top. Using the .618 Fibonacci ratio targets 5,280 as a potential top.
However, sometimes a fifth wave will not exceed the termination point of the third wave. This is called a truncated fifth wave, when they occur they typically will retrace between 90 to 99.99% of the prior fourth wave movement. There’s nothing in Elliott wave theory that can predict when a fifth wave could truncate. But what’s happening between the DJI and the other two main US stock indices since the October 2022 bottom, hints the SPX may not make a new high in 2023.
The daily DJI chart illustrates its powerful move up from the October low.
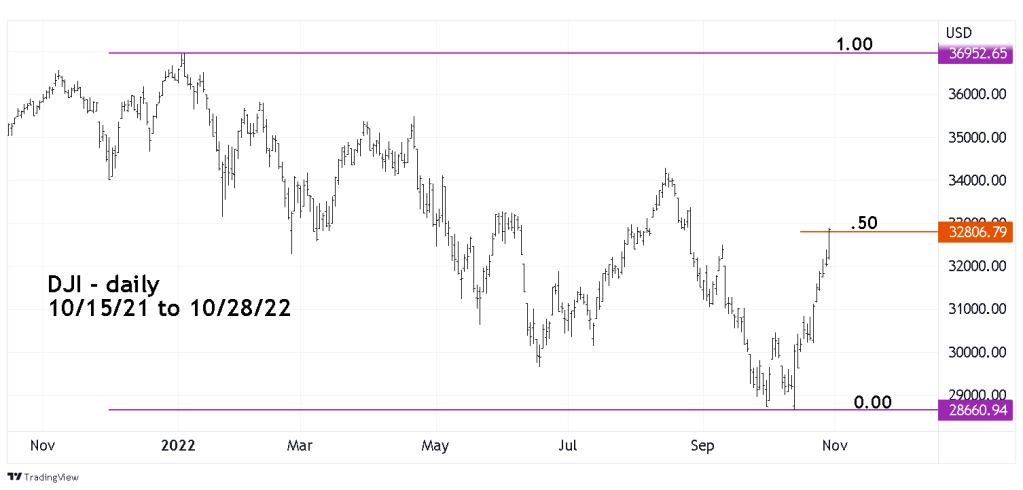
At the 10/28/22 high the DJI had retraced 51% of its 2022 decline. After looking at this chart it’s not so far fetched to think this index could make a new high in 2023. Also, November is seasonally the most bullish months for stocks. With November beginning next week its possible the DJI could make a new high before the end of 2022.
What about the SPX? So far its retraced only 31% of its 2022 decline.
The Nasdaq Composite has only retraced a pathetic 18% of its bear move. This index has a very low probability of making a new high in 2023, the SPX is also doubtful.
If the DJI rally continues, a blog will examine its long-term Elliott wave structure and potential price targets for a new all-time high.
Never underestimate the persistence of a stock bull market or a stock bear market rally.
