Some traders/investors think that when stocks go up bonds go down, the reverse if stocks are going down. This is not always true. Sometime stocks trade inverse to bonds, sometimes they trade together. If on 10/24/22 US government treasury bonds made an intermediate bottom it’s rally could correspond with US stocks rising.
The I-Shares 20 – year Treasury bond – ETF (TLT) is a good proxy for the US government bond market.
The weekly TLT and S&P 500 (SPX) chart courtesy of Trading View illustrates their long – term relationship.

For several weeks TLT and SPX can have an inverse relationship, or they can trend together for several weeks.
The daily TLT and SPX chart focuses on the short-term view.
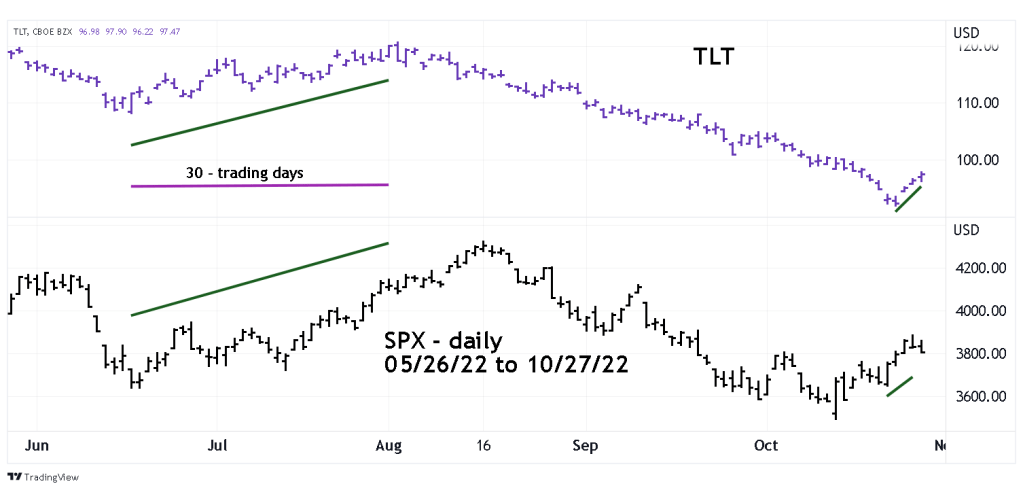
The most recent TLT rally corresponded with the prior SPX multi-week rally. The TLT rally lasted 30 – trading days.
Adding 30 – trading days to the TLT 10/24/22 bottom targets 12/06/22 as a potential TLT top. If stocks move up with TLT, the SPX could peak on the same day or one week before/after 12/06/22.
