Several clues from interest rates and bonds imply a trend reversal may have begun.
The 10/19/22 blog “US Interest Rates Could be Near a Top” noted that the monthly CBOE 30 – year Treasury Bond Yield (TYX) was nearing a resistance zone. The TYX price action on 10/21/22 was dramatic and the first hint of a potential reversal.
The daily TYX chart courtesy of Trading View illustrates the trend since July 2022.
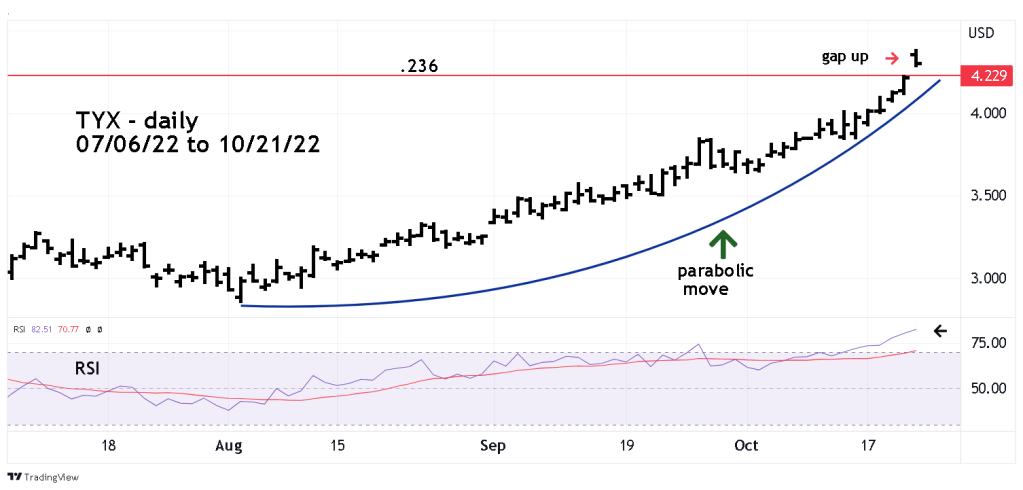
In August a parabolic rise began, then on 10/21/22 a huge gap up near the open of the trading session. TYX then trended lower for the rest of the day closing near the low. Yields/rates move inverse to bonds/notes. After months of the 30- year US Government Treasury bonds trending lower, 10/21/22 may have been a climactic burst of bond selling.
The 10/19/22 blog noted that the Fibonacci .236 retracement of the TYX secular bear market from October 1981 to March 2020 was at TYX 4.229. The TYX high on 10/21/22 was 4.383 which is a .246 retracement of the bear market and within leeway of the .236 level.
Also note that on 10/21/22 the daily RSI reached 82.51, this is the highest level since the last short-term bottom made in December 2021. Several blogs on this site have noted price almost always peak with at least one RSI bearish divergence. This phenomenon applies to stock market indices – which rarely have parabolic movements. For commodity and interest markets where parabolic moves are more common, there’s a greater probability that price could peak on a maximum RSI reading.
The weekly CBOE 10- Year Treasury Note Yield (TNX) chart reveals additional clues.

Interest rate/bond markets are probably the worst candidates to analyze with Elliott wave theory. A price segment may have a clear pattern, yet it may not fit very well with prior or subsequent movements.
The TNX movement up from the March 2020 bottom shows a rare and clear extended Elliott wave impulse pattern. Please note that the supposed Intermediate wave (4) overlaps into the territory of Intermediate wave (1). The Elliott wave rule that impulse waves ‘four” do not cross over the area of wave “one” applies only to stock indices.
Also note that weekly TNX – RSI has a double bearish divergence.
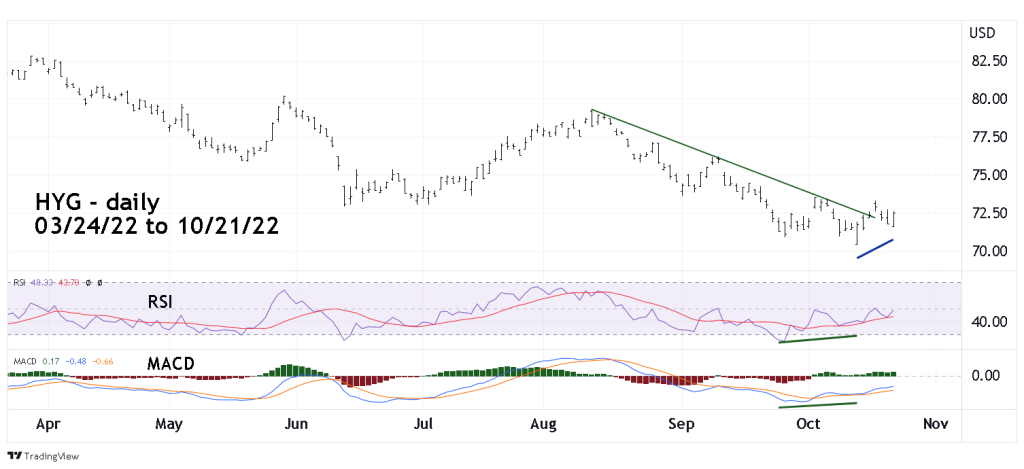
The daily I- Shares High Yield Corporate Bond – ETF (HYG) chart shows the strongest evidence of a potential reversal.
During the last few weeks, several of this sites blogs noted that the Russell 2000 (RUT)- small cap stocks were declining slower than the large cap S&P 500 (SPX). Its logical to expect in an economic downturn that small cap stocks should be leading the way down. They weren’t, and when US stocks went down on 10/13/22, RUT had still not gone below its 06/16/22 bottom. The SPX on 10/13/22 was decisively below its mid- June 2022 bottom
The same phenomenon could be happening with HYG and US Treasury bonds. HYG represent the lowest quality of bonds, sometimes referred to as “Junk Bonds”. US Treasury bonds are the highest quality.
On 10/21/22 while TYX was making a new high, US Treasury bonds were making a new low. Yet HYG was decisively above its 10/13/22 bottom – also the same day the SPX bottomed. Note that going into the 10/13/22 bottom HYG also had bullish divergences on the RSI and MACD.
Long -term evidence strongly suggests that a multi- year or even a multi- decade interest rate bull market may have begun in March 2020. Please see the monthly TYX – Log scale chart illustrated in the 10/19/22 blog. However, there’s a high probability that a multi-week or multi-month correction within a developing bull market may have started.
If US interests rates decline it could be a catalyst for a multi- week rally in US stocks.
