On 07/22/22 the S&P 500 (SPX) hit round number resistance at 4,000 and then trended down for most of the session. Is this the start of the next down wave in a bear market? Perhaps, however short-term and long-term momentum indicators suggest there could be more upside action.
The daily SPX chart courtesy of Trading View updates short-term momentum.
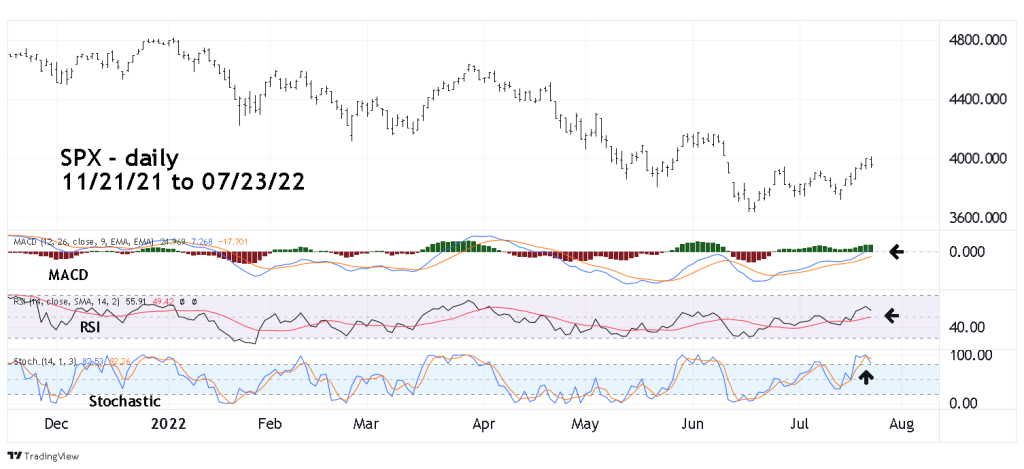
So far, daily MACD has only one line above the “zero” level and RSI is still in the neutral zone. Daily Stochastic has a bearish lines crossover in the overbought zone. This signal is unconfirmed by the other two momentum indicators and suggests a decline of only a few days.
The weekly SPX chart examines long-term momentum.
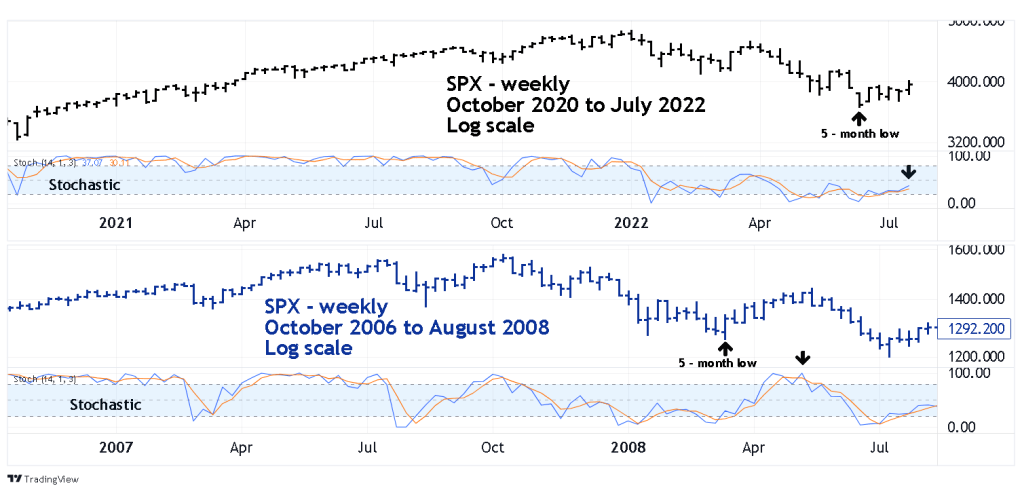
The 07/07/22 blog “Long -Term Momentum Implies a Multi – Week Stock Rally” examined the SPX – monthly Stochastic going back to the 2007 to 2009 bear market Five – months after the SPX major 2007 top, a short-term bottom occurred followed by a nine – week rally.
The rally after the March 2008 SPX bottom resulted in the weekly Stochastic reaching the overbought zone. The current SPX rally which began in June 2022 has lasted five – weeks with a Stochastic reading of only 40% implies there could be more upside action.
US stocks are seasonally bullish from July to August. The “Bullish Breakout – 07/20/22” blog illustrated an SPX price cluster that begins at SPX 4,080. Long and short -term momentum indicate there’s room for more rally. The weight of evidence from the time and momentum dimensions suggests the SPX rally could reach the zone of 4,080 to 4,220. The time zone for a potential top is from 08/04/22 to 08/22/22.
