The 05/28/22 blog “Examination of Two Major Bear Markets” noted that the 2022 decline of US stock market was taking a complex pattern similar to the 2000 to 2002 bear market.
The daily S&P 500 (SPX) chart courtesy of Trading View updates the Elliott wave count.
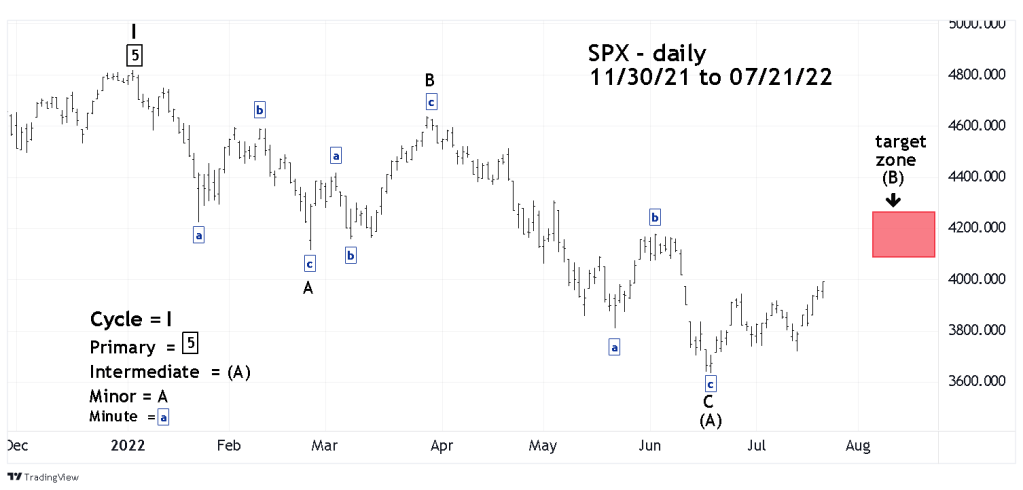
Normally the complex Elliott wave patterns such as Double Zigzags, Triple Zigzags, and Combination waves would have the notations as “X,” “Y” and “Z” waves. For the sake of clarity and simplicity this illustration has the notations of “A,” “B,” and “C.”
The January to June 2022 decline is a Double Zigzag. The presume Intermediate wave (B) rally currently counts as a Zigzag, it could later develop into a Double or even a Triple Zigzag.
Note that on a longer-term perspective the Double Zigzag decline into the SPX June 2022 bottom could be a completed bear market. If so, in the next few months the SPX could rally into a new all-time high. Based on long -term bearish evidence from the price, time, and momentum dimensions an SPX move to new highs is a low probability.
Based on the weight of evidence illustrated in several blogs, the most likely course for the SPX is a rally into an intermediate peak in August 2022.
If the SPX and the other two main US stock indices make a top in August 2022 the next decline could go far below the June 2022 bottom.
