The 06/16/22 blog “Forecast for a Short-Term Bottom” noted that a S&P 500 (SPX) daily MACD bearish crossover could be forecasting a short-term bottom sometime in the last week of June 2022.
Subsequently US stocks have rallied, this move could be the prelude for another decline.
The 05/28/22 blog “Examination of Two Major Bear Markets” illustrated that the Dow Jones Industrial Average (DJI) decline from the January 2022 top appears to be taking the form of an Elliott wave – Double Zigzag. It’s possible the Nasdaq Composite (IXIC) drop from its all-time high is an Elliott five- wave Impulse pattern.
The daily IXIC chart courtesy of Trading View illustrates the action.
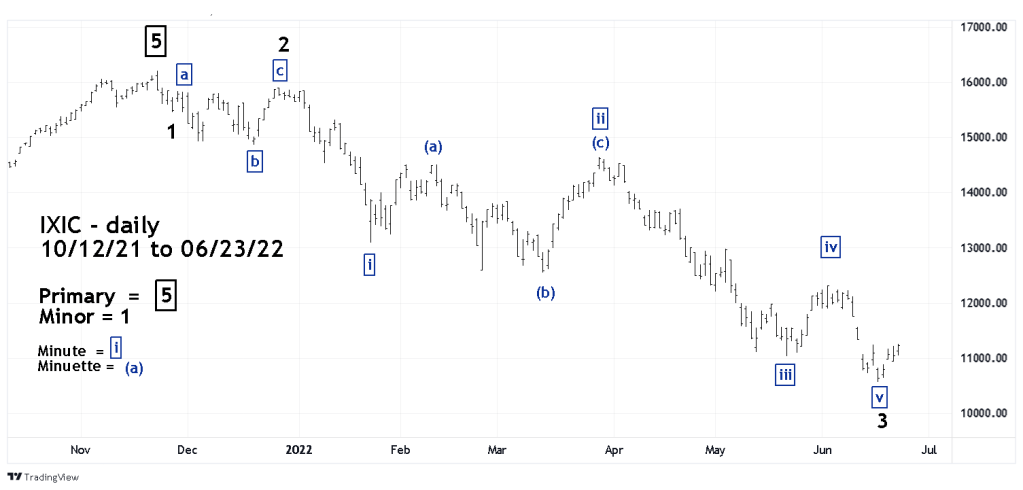
The IXIC recent rally could be Minor wave “4” of a developing five wave impulse down from its 2021 all-time high. If the rally soon terminates the next decline could make a new bear market low.
The daily IXIC chart from 2019 to present illustrates where a short-term bottom could form.

The IXIC could be headed toward a .618 retracement of the IXIC bull market from March 2020 to November 2021. The exact level is 10,256.53 near chart support made on 07/24/20 at 10,217.23.
The time zone for a possible bottom is 06/28/22 to 06/30/22. There’s a New Moon on 06/28/22. The end of the second quarter of 2022 stock trading is 06/30/22.
