On 06/10/22 the S&P 500 (SPX) – daily MACD had a bearish lines cross over below the zero line. This is a rare event, the last time it happened was on 12/17/18, that occurrence could help to discover a short-term bottom for the current SPX decline.
The daily SPX chart courtesy of Trading View illustrates the MACD signal in December 2018.

The bearish lines crossover happened on 12/07/18, 12 – trading days later a bottom was made on 12/26/18.
The next daily SPX chart shows the MACD bear cross in June 2022.
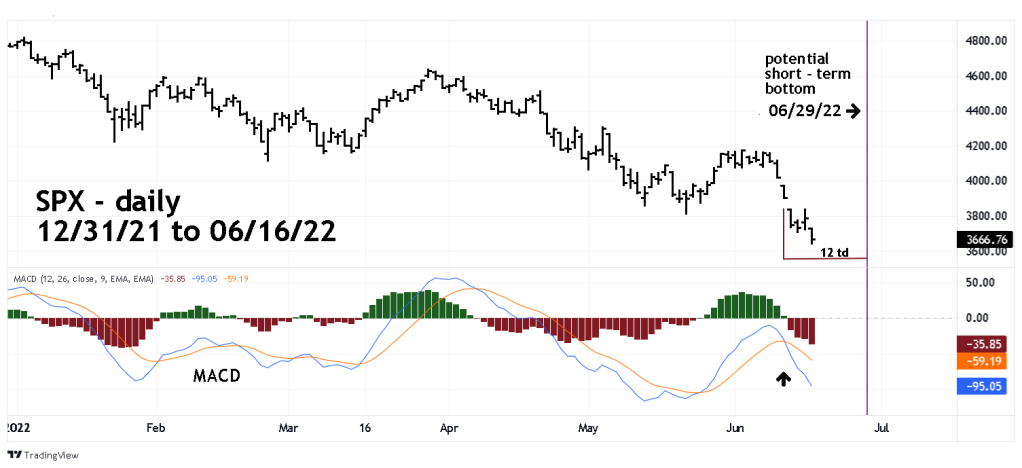
Adding 12 – trading days to 06/10/22 targets 06/29/22 as a potential short-term bottom. There’s a New Moon on 06/28/22, the end of the second quarter of 2022 trading is 06/30/22.
If a bottom is made it could be another temporary bottom in an ongoing bear market. A future blog will examine when and at what price a significant bottom could occur.
If the SPX bottoms in the last week of June 2022 it could be in the low 3500 area – please see the 06/14/22 blog “The Next S&P 500 – Support Level”.
