The 06/11/22 blog “Watch the S&P 500 – Trendline” concluded with the following.
“The bears are in control – important points to watch are – support zone near 3880, the 05/20/22 bottom at 3810.32, and the declining daily trendline.”
The daily S&P 500 (SPX) chart courtesy of Trading View updates the action.
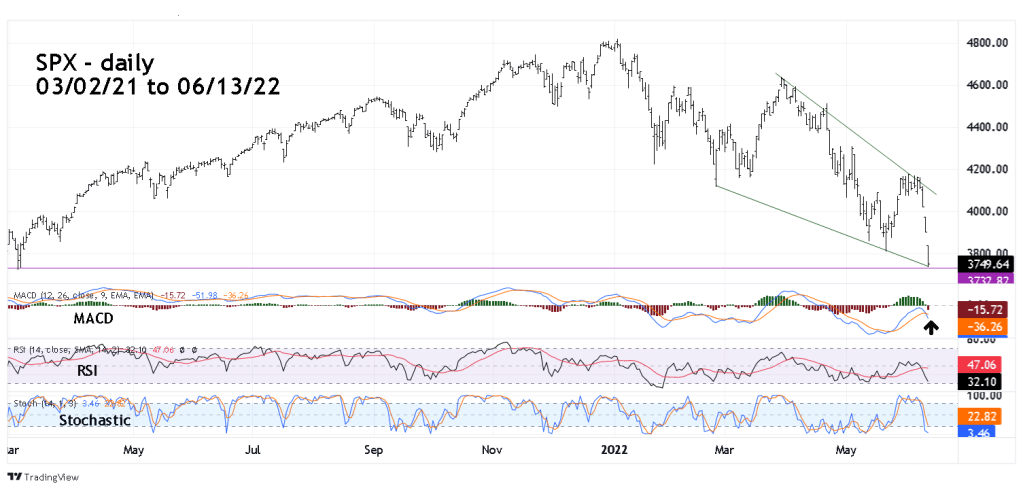
Today 06/13/22 the SPX low hit the lower declining trendline at 3734.30 slightly above chart support made on 03/05/21 at 3730.19.
Daily momentum indicators look like they could go lower.
RSI is at 32% above the oversold border of 30%.
Stochastic slow line – orange is at 22% above the oversold border of 20%.
MACD is the most bearish of the three with a bearish lines cross over.
The SPX – 15-minute chart courtesy of BigCharts.com illustrates the intraday action.
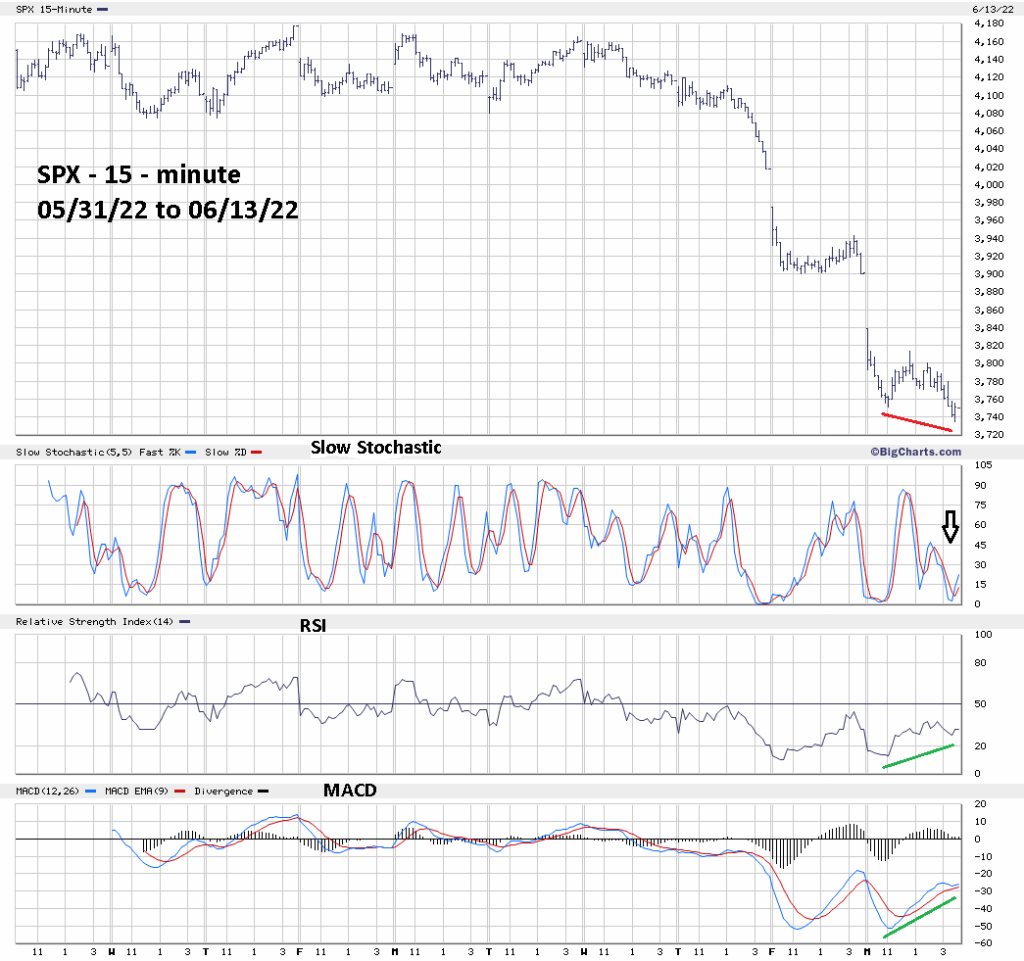
At the 06/13/22 bottom RSI and MACD had significant bullish divergences.
Slow Stochastic had a bullish lines crossover.
On 06/15/22 the FOMC will make its next interest rate announcement. On 06/14/22 the SPX could have a modest rally. The next big move up or down will probably occur after the FOMC announcement at 2:00 PM – ET 6/15/22.
The daily momentum indicators suggest the SPX could have more downside action.
The 06/14/22 blog will examine the next potential support zone.
