This current blog was going to be a comparison of the stock bear market of 2007 to 2009 with the 2022 decline. The powerful move down of US stocks on 06/10/22 has cause that comparison to be put on hold.
The 06/09/22 blog “Break of S&P 500 Support” noted that the rally after the 05/20/22 bottom only lasted eight trading days and that more rally time could be needed before the next major bear move begins. The momentum readings for the S&P 500 (SPX) on 06/10/22 imply that the major move down could be underway.
The daily SPX chart courtesy of Trading View illustrates the action.
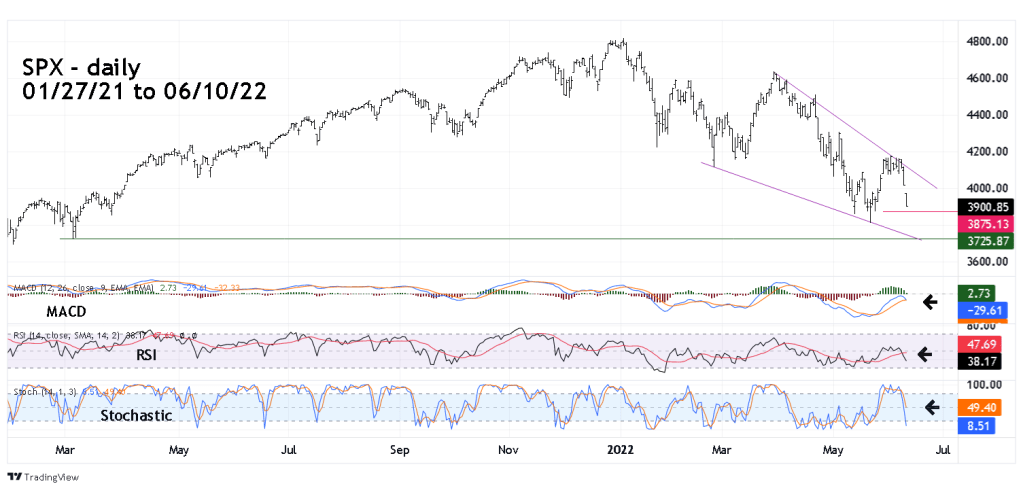
Daily MACD lines are on the verge of a bearish cross over and the Histogram is on the verge of going below the zero line.
RSI has a bearish crossover of its moving average and the Stochastic slow line – in orange is only at 49%.
On 06/10/22 the SPX pushed below its most likely support zone in the 3950 area and appears it could break below the alternate support zone near 3880. Major support is the SPX 05/20/22 bottom at 3810.32.
A fascinating aspect of the SPX 2022 decline is that its formed a declining wedge which implies an Elliott wave – Ending Diagonal Triangle (EDT) is developing. If so, the SPX 2022 decline would be the “C” wave of an Expanding Flat correction that began at the 11/22/21 peak. If this count is developing, it implies that after completion the SPX could rally to a new all-time high.
This is a low probability wave count because of the size of the supposed EDT sub waves. Within EDT’s the third wave is almost always shorter than the first wave. The presumed third wave down of the EDT ended at the 05/20/22 bottom, which is slightly larger than the presumed first wave that ended on 02/24/22.
A break below the lower trendline could signal additional downside action. Declining EDT’s normally terminate with a brief overthrow of the lower trendline. On this scale a one-day overthrow is the most likely scenario. If the SPX travels more than one – day below the lower trendline it could have very bearish implications.
The bears are in control – important points to watch are – support zone near 3880, the 05/20/22 bottom at 3810.32, and the declining daily trendline.
