Today 06/09/22 the S&P 500 (SPX) broke below important support at 4073.84 which opens the door for additional decline.
The SPX 30 – minute chart courtesy of Trading View illustrates the action.
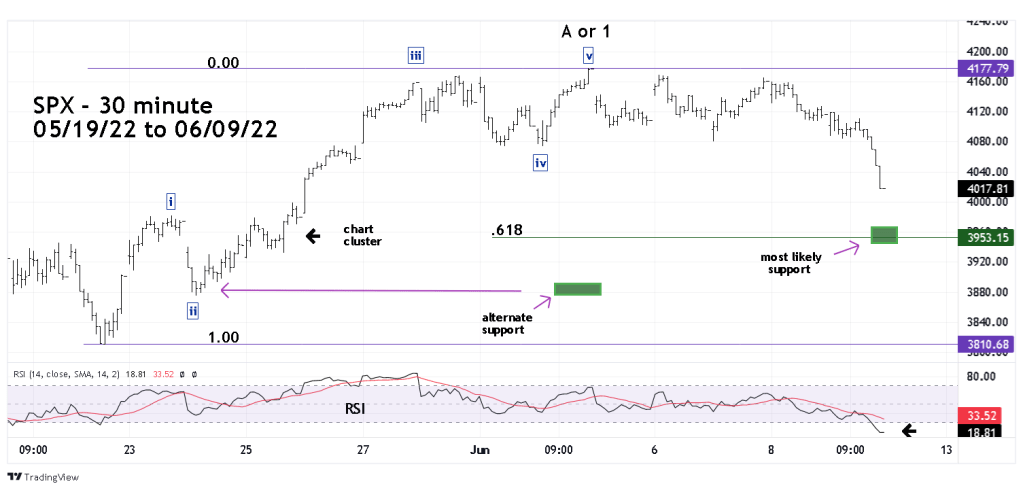
This chart updates the SPX 15 – minute chart illustrated in the 06/04/22 blog “Three Possible Paths for the S&P 500”. That chart showed a moderate bearish Elliott wave count. This wave count is the most likely scenario because of the briefness of the rally after the 05/20/22 bottom. The rally lasted only eight trading days, if a large SPX bear market is developing its likely more rally time is needed before the next major bear drop begins.
The SPX could have additional downside action that holds above the 05/20/22 bottom – then have a second rally at least back to the 06/02/22 peak.
The SPX ended the 06/09/22 session extremely oversold. Trading on 06/10/22 is likely to have an oversold rally bounce before resuming the decline.
The SPX decline today triggered two stop orders on a 100% long position of SPX non-leveraged related funds. The profit was 1.08%.
The next blog will compare the SPX 2022 decline with the SPX 2007 to 2009 bear market.
