On 06/02/22 the S&P 500 (SPX) bottomed early in the session then persistently rallied 2.5% closing the session slightly off the high of the day. Typically, in a stock bull market the next trading day would have at least marginal gains. On 06/03/22 – SPX opened the session down 1.1% and trended down during most of the day. Could this drop be a pause that refreshes or the start of a larger decline?
First we need to examine the daily SPX momentum with a chart courtesy of BigCharts.com.

The BigCharts.com – Stow Stochastic indicator is very effective in identifying potential trend changes. In late May, daily Slow Stochastics reached the overbought zone above 80% then had a bearish crossover. This signal implies at least a multi-day decline may have begun.
The hourly SPX chart courtesy of Trading View examines a potential bullish Elliott wave count.

In this wave count the presumed Minute wave “v”- boxed is extending. If this scenario happens the SPX could climb to at least 4300. The daily Slow Stochastic would most likely flatten in the overbought zone – if the SPX were to soon exceed the 06/02/22 high.
A move below SPX 4074.37 could open the door for a moderate bearish wave count illustrated in the SPX – 15 – minute chart.
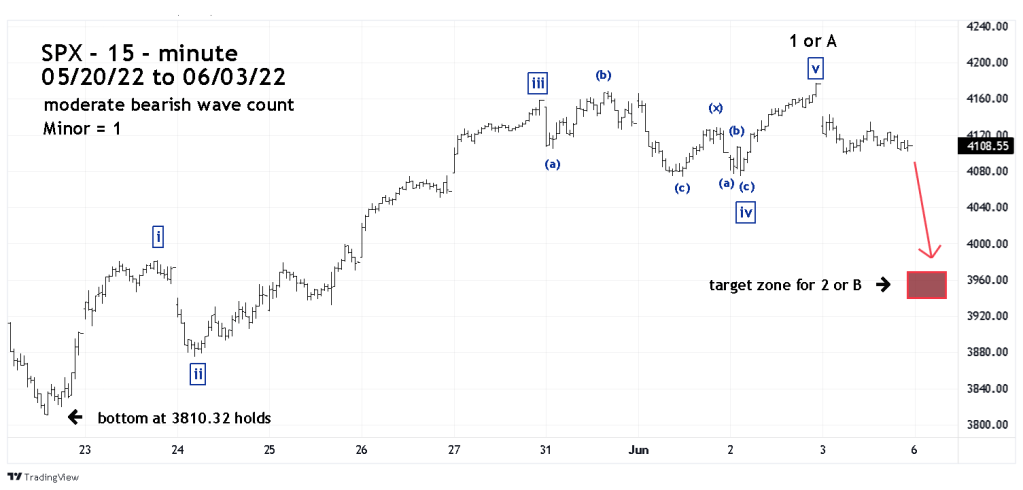
In this wave count the presumed Minute wave “iv” is a Combination wave composed of an Expanding Flat followed by a Single Zigzag. Typically wave “Two” or “B” retrace about 60 to 66% of the prior waves “One” or “A”.
The second SPX hourly chart shows a very bearish wave count.
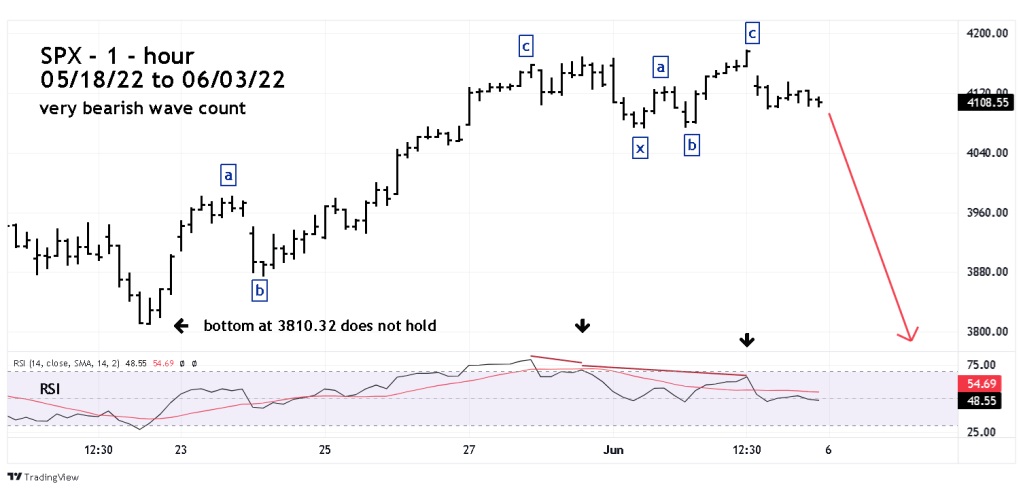
In this wave count the move up from the SPX 05/20/22 bottom is a Double Zigzag correction. The next down move would probably break below the 05/20/22 bottom.
The 05/31/22 blog “S&P 500 Momentum Update 05/31/22” illustrated a bearish divergence on the SPX – hourly RSI. At the SPX 06/02/22 peak there was a double bearish RSI divergence.
Traders are long 100% SPX non-leveraged funds. Raise the stop loss on half of the position to SPX 4074.36. Use a move below SPX 4050.00 as a stop loss on the remaining position.
