Today 04/21/22 the S&P 500 (SPX) opened above the high made on 04/20/22. The rally lasted only 21 – minutes, what followed was steep drop that continued throughout the trading day. The few rally attempts were shallow, the bears dominated.
The 5 – Minute SPX chart courtesy of Trading View illustrates the action.
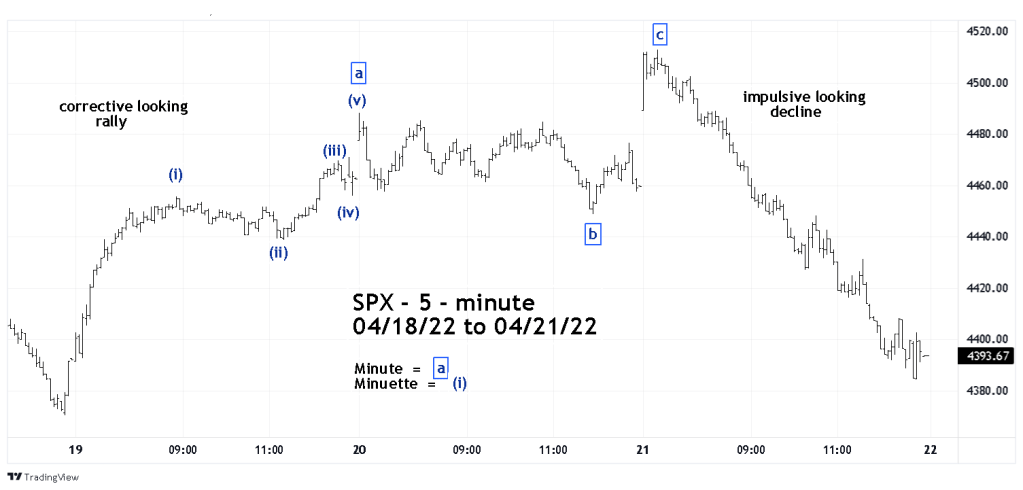
The rally from the 04/18/22 bottom is choppy, characteristic of corrections to the main trend. in this case the presumed trend is down. The 04/21/22 drop is smooth and steady; it looks like an Elliott impulse wave.
There are always alternate Elliott wave counts. A bullish alternate wave count from the 04/18/22 bottom has a count that begins at the Minute wave “a” – boxed high. The subsequent Minute wave “b” could be the first part of an Expanding Flat correction. The rally to the 04/21/22 high could be the second part of the Expanding Flat. The 04/21/22 drop could be the third and final part of the Expanding Flat.
The next 5 -minute SPX chart illustrates the alternate wave count.
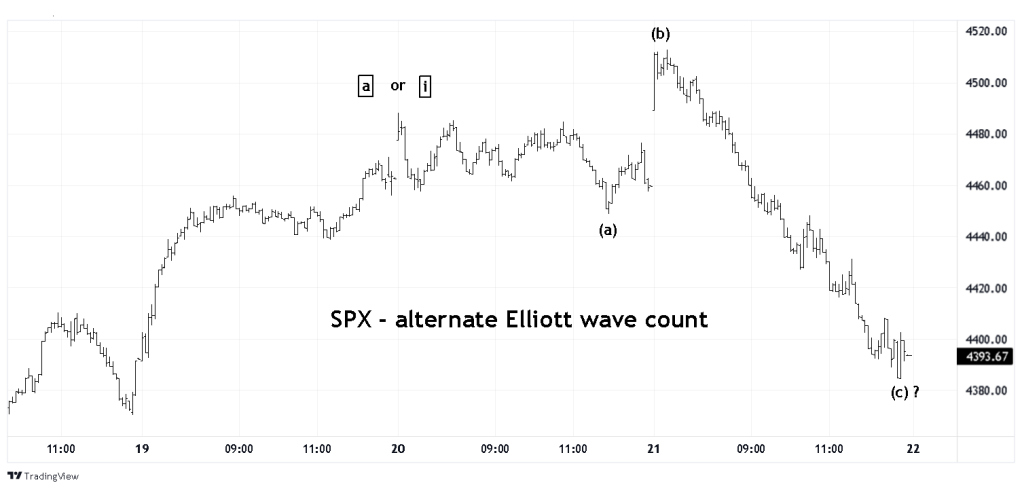
If within the next few trading days, if the SPX exceeds the 04/21/22 high, this potential Expanding Flat will be further examined.
The 04/21/22 sharp decline warrants caution. Traders are long 50% non-leveraged SPX related funds from the 04/18/22 open. Sell half of the position on the SPX open 04/22/22. Sell the remaining half if the SPX moves below 4360.00.
