The prior blog illustrated a presumed Elliott wave – Expanding Flat correction for the S&P 500 (SPX) that’s been developing since November 2021. This blog zooms in on the third part of the Expanding Flat. This phase began at the all-time high in early January 2022 and appears to be an Elliott wave – Ending Diagonal Triangle.
Ending Diagonal Triangles (EDT) are found at the termination points of larger patterns . They occur in wave “five” of motive patterns and in wave “C” of corrective patterns. In the case of the SPX since early January its Intermediate wave “C” of the Expanding Flat that began in November 2021.
EDT’s are the only motive pattern in which all the sub waves divide into three waves or a combination of three waves. Frequently the third wave is shorter than the first wave and the fourth wave almost always crosses into the territory of the first wave.
EDT’s take a wedge shape within two converging lines. Frequently wave “five” will have a throw over of the trendline connecting waves “one” and “three.”
The 30- minute SPX chart courtesy of Trading View illustrates the presumed EDT developing since 01/04/22.
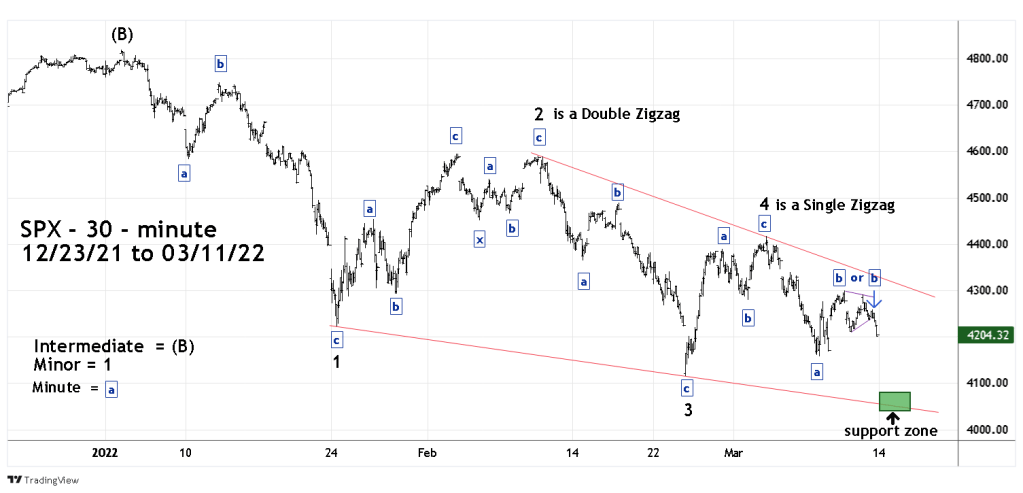
One of the guidelines in Elliott Wave deals with alternation which helps traders to expect something different in the next expression of a similar wave. In the case of the presumed SPX EDT the alternation occurred with Minor wave “2” a Double Zigzag and “ Minor wave “4” a Single Zigzag.
The prior blog “Expanding Flat Could be Nearing Completion” noted three potential SPX support points.
A Fibonacci relationship between Intermediate wave (A) and (C ) that targeted 4072.49.
A Fibonacci relationship between Intermediate wave (A) and (C ) that targeted 4048.05.
Chart support at the 05/12/21 bottom of 4056.88.
Examination of the EDT from 01/04/22 provides a fourth support point.
There’s usually a Fibonacci between the first and fifth waves of motive patterns.
Minor wave “1” of the EDT was 596.00 points, multiplied by the Fibonacci ratio of .618 yields 368.32 points. The Minor wave “4” peak was 4416.78 minus 368.32 targets SPX 4048.46 as the termination point for Minor wave “5”. This is close to the other three support points and in the area of the lower trendline.
The short-term SPX – Elliott wave pattern based on the action made on 03/11/22 implies there could be a sharp decline on 03/14/22.
The next blog will examine what could trigger a sharp one- or two-day drop.
