Elliott Wave – Ending Diagonal Triangles (EDT) are termination patterns that appear only in the fifth wave positions of motive waves and in wave “C” of corrective waves. They frequently show up in the “C” wave of Expanding Flats.
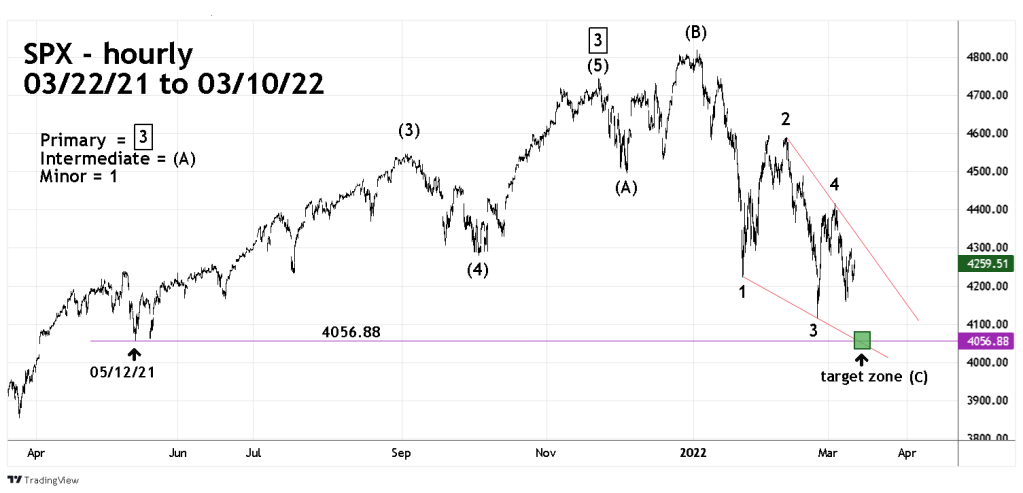
The hourly S&P 500 (SPX) chart courtesy of Trading View illustrates an Expanding Flat that began on 11/22/21, with an EDT that began on 01/04/22.
The presumed Intermediate wave (A) was 248.71 points.
The presumed intermediate wave (B) was 323.50 points.
The ratio of B/A is 323.50/248.71 = 1.30. The most common Fibonacci ratio of “B” to “A” in Expanding Flats is 1.236. The next most common Fibonacci ratio is 1.382. The 1.30 ratio splits the difference.
Multiplying wave (A) 248.71 x 3 equals 746.13 points.
The wave (B) high is 4818.62 minus 746.13 equals 4072.49 as a target for Intermediate wave (C).
Multiplying wave (B) 323.50 x 2.382 equals 770.57 points.
Subtracting 770.57 from 4818.62 yields another target of 4048.08 for Intermediate wave (C ).
There’s chart support at 4056.88 the correction bottom made on 05/12/21.
The broader support zone for Intermediate wave (C ) 4040 to 4080.
The wave (C ) could bottom on 05/11/22 or 05/14/22.
Depending on market conditions the next blog will examine how the presumed Expanding Flat fits within the broader Elliott wave pattern since March 2009.
