After the 02/24/22 bottom US stocks appeared to be poised for a rapid move up, but after two days a trading range developed. Meanwhile, German stocks as measured by the DEU40 have continued to make new decline lows. Evidence from the DEU40 could be providing clues as to the near-term direction for the global stock market.
The US stock market as measured by the S&P 500 (SPX) has three potential Elliott wave counts. The 15 – minute SPX chart courtesy of Trading View illustrates the action after the 02/24/22 bottom.
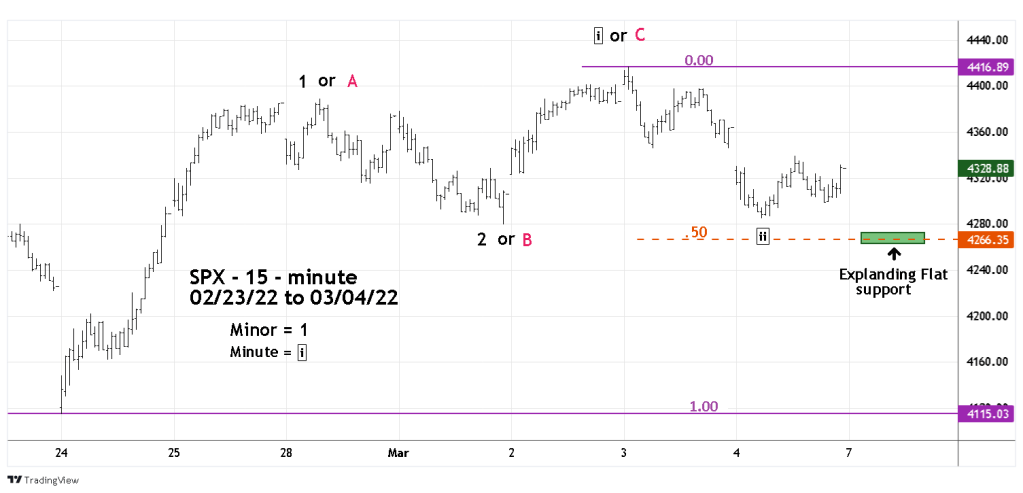
Wave count #1: A series of “one’s’” and “two’s” up has developed after the 02/24/22 bottom. This is a bullish count and implies the SPX could rally at least back to the high made on 01/04/22. In this count the second wave “one” up – labeled as Minute wave “i” – boxed peaked on 03/03/22. The subsequent decline to 4284.98 is the presumed Minute wave “ii.” A break below the 03/01/22 bottom at 4279.54 would invalidate this wave count,
Wave count #2: is a Single Zigzag (A,B,C) corrective pattern. This is a bearish wave count and implies a move down at least back to the 02/24/22 bottom.
Wave count #3: could be an Expanding Flat corrective pattern under development. For the sake of clarity this count is not illustrated. If it does develop, a future blog will show the details. The important factor is where the potential Expanding Flat could terminate. There’s a secondary Fibonacci coordinate close to the 50% retracement level of the SPX 02/24/22 to 03/03/22 rally. The green rectangle represents the zone where the Expanding Flat could terminate. If the SPX does decline and bottoms in this zone it would create a bear trap for traders shorting the break below the 03/01/22 bottom at 4279.54.
The daily DEU40 illustrates clues of a possible near-term bottom.

The DEU40 has gone just below the .382 retracement of the bull market from March 2020. Additionally, it is just above the chart bottoms made on 12/14/20 and 12/20/20. This is a logical support zone to expect at least a short-term bottom.
Momentum evidence supports this theory. Both daily Stochastic and RSI have reached the oversold zone.
If the DEU40 is forming a near-term bottom- other major national stock indices could rally. If so, the most like direction for the SPX on 03/07/22 is up.
