Since the US stock market all-time high in early January 2022 there have been clues that the subsequent decline may have only been a correction within an ongoing bull market.
Clue #1: The S&P 500 (SPX) peak at 4818 was outside of the lower leeway zone for potential major Fibonacci resistance at 4889. The lower leeway zone was from 4889 to 4840.
Clue #2: The SPX deep retracement of the 01/04/22 to 01/24/22 decline that topped on 02/02/22. Also, the SPX pushed into the territory of a presumed wave “one” down. Please see the 02/02/22 blog “ Bullish Crossover.”
Clue #3: Several bullish momentum signals at the 02/24/22 bottom.
Most of the time for US stocks the SPX has the clearest Elliott wave pattern. For the decline from early January 2022 to late February, the Dow Jones Industrial Average (DJI) has the clearest pattern.
The two – hour DJI chart courtesy of Trading View illustrates a detailed Elliott wave count.
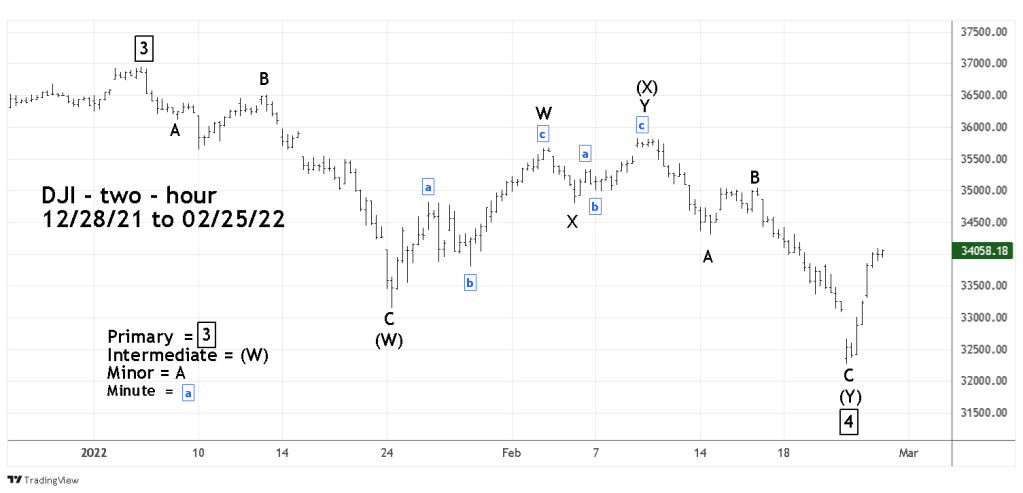
The most likely Elliott wave count is a Double Zigzag corrective pattern. Note that Intermediate wave (X) which topped on 02/09/22 is also a Double Zigzag. For the SPX, the 02/09/22 high is below the 02/02/22 top. This is an example of a truncated wave, when the third wave of a three-wave correction fails to exceed the termination point of the first wave of the correction.
An intraday view of both the DJI and SPX intraday charts reveals a choppy pattern, a characteristic of corrections in the main trend. Additionally, a weekly chart shows that both the DJI and SPX are clear three wave declines. On a weekly chart the designations of (W), (X), and (Y) could also be labeled (A), (B), and (C).
Evidence from the long- term Elliott wave count back to March 2009 supports the theory that a corrective pattern terminated on 02/24/22. There are several fascinating clues which will be detailed in the next blog.
