The 02/24/22 dramatic reversal after a powerful decline may have created an important bottom for US stocks.
The daily S&P 500 (SPX) chart courtesy of BigCharts.com illustrates several bullish signals.
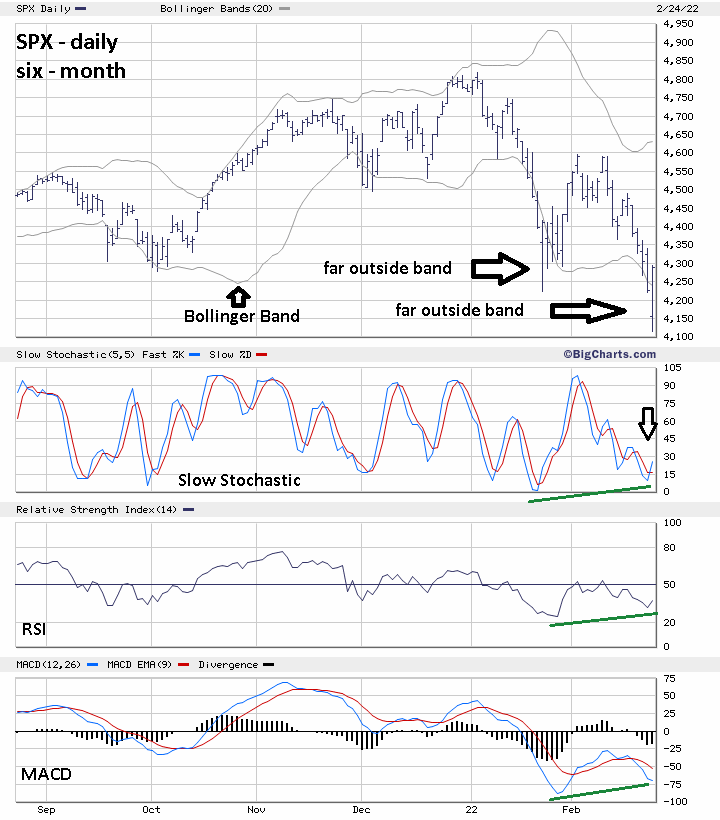
There were bullish divergences on the daily Slow Stochastic, RSI and MACD vs. the higher bottom made on 01/24/22. Slow Stochastic had a bullish lines crossover. Also note how far the SPX was outside the lower Bollinger Band. Its similar to the SPX action on 01/24/22. Today’s signal implies there could be a post 02/24/22 rally at least as large as the post 01/24/22 rally.
The daily SPX chart courtesy of Trading View illustrates a Fibonacci support level.

The 02/24/22 SPX bottom was near a .618 Fibonacci retrace of the rally from the 01/29/22 bottom.
The 30 – minute SPX500 – Point & Figure chart shows support levels.
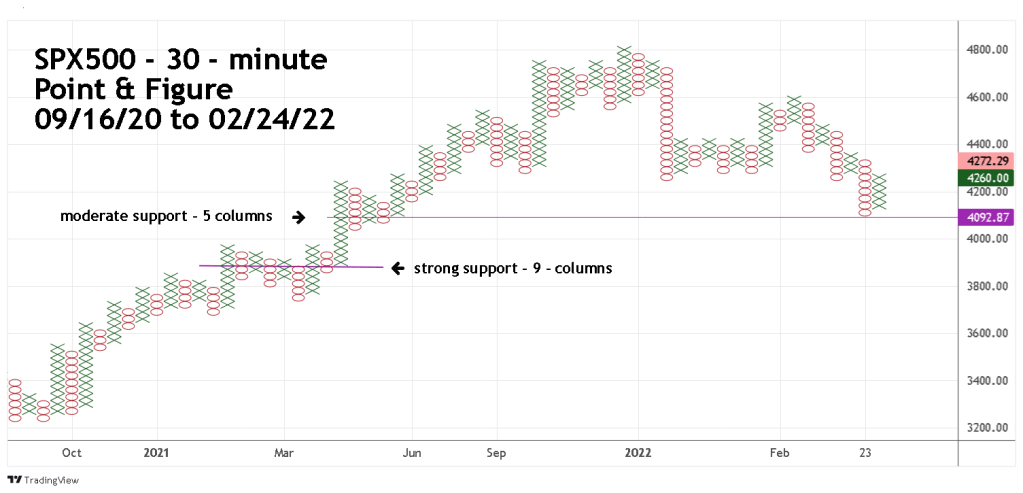
The SPX500 02/24/22 bottom was just above a moderate support level of 5 – columns.
Traders had reversed half of a 50% long position to short on a break below SPX 4290. Subsequently the position was stopped out on a 1% move above the short entry point.
Just before the close of the main session the SPX had rallied to just above SPX 4290. Daily momentum indicators strongly imply more upside action – coming soon.
After the SPX deep retracement that peaked on 02/02/22, I’ve noted that the decline from the 01/04/22 top could be a correction within an ongoing bull market. The dramatic reversal and bullish momentum signals made on 02/24/22 adds additional evidence to this theory.
The next blog will give a detailed Elliott wave explanation as to why the drop from early January 2022 could be correction.
