The 10/24/21 Blog “Possible US Stock Market Top – December 2021” used Fibonacci Time cycles to forecast a possible significant top for US stocks sometime in December 2021. This blog uses Fibonacci price analysis on the S&P 500 (SPX) to discover a possible major top of the bull market that began March 2009.
When making price comparisons for markets or stocks with large percentage gains its better to use Logarithmic scale instead of Arithmetic scale. For example, a stock going from 8.00 to 10.00 has a much larger percentage gain than a stock rising from 98.00 to 100.00.
Within Elliott five- wave impulse patterns there’s usually a Fibonacci relationship between sub waves “one” and “five.”
The daily SPX chart 2008 to 2010 courtesy of Trading View illustrates the presumed Primary wave “1”.
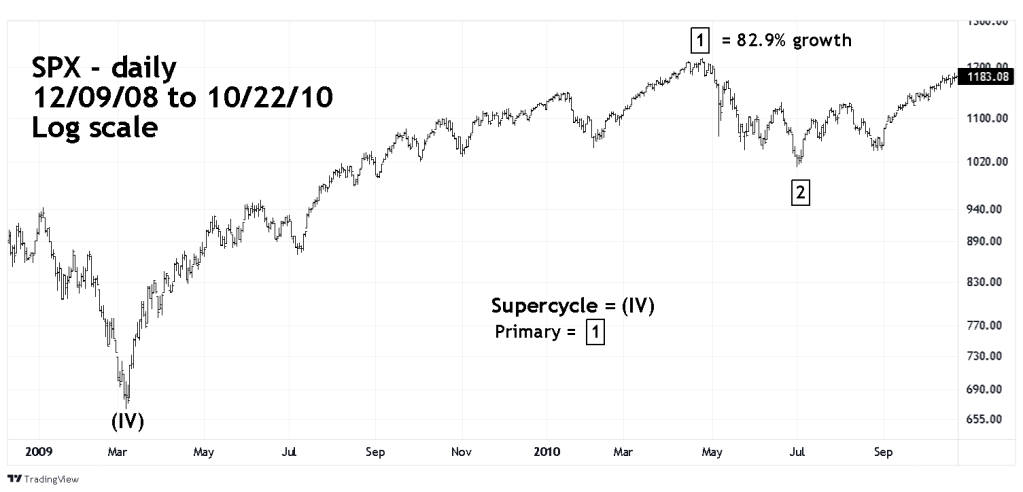
Several blogs have noted that the March 2009 to April 2010 SPX bull phase was Primary wave “1” of a five- wave impulse pattern which is presumed to be continuing into 2021. The supposed Primary wave “1” had a growth rate of 82.9% from the major bottom made in March 2009. The 82.9% growth rate is the starting point to discovering the bull market price termination point.
The daily SPX chart 2020 to 2021 illustrates the price action since the February 2020 peak.
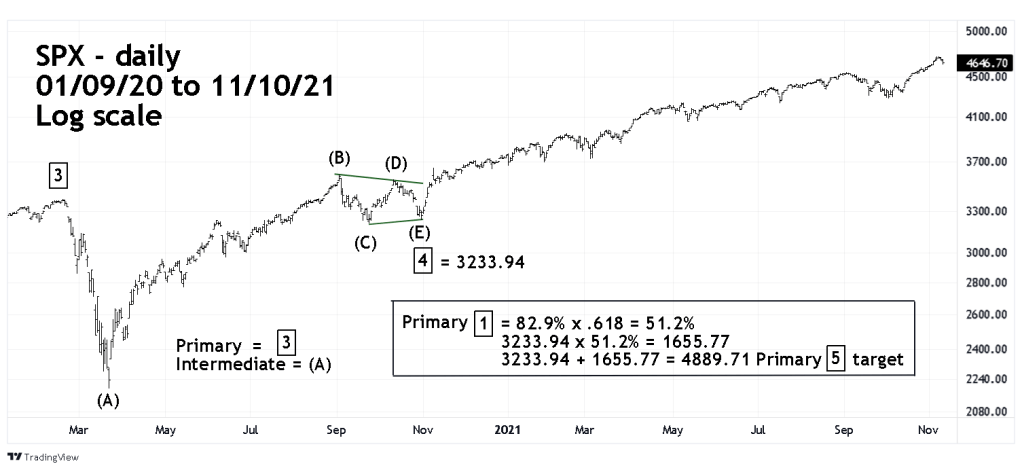
Several blogs have noted that best SPX – Elliott wave count from February 2020 to October 2020 was a Horizontal Triangle. In this pattern sometimes Fibonacci price/time analysis can be made from the end of the wave “A” position. Most of the time Fibonacci analysis is made from the termination point of wave “E” which in this case is the SPX 10/30/20 bottom.
The growth rate of Primary wave “1” was 82.9% multiplied by the Fibonacci ratio of .618 yields a growth rate of 51.2%. A growth of 51.2% from the SPX 10/30/20 bottom of 3233.94 targets SPX 4889.71 as a possible termination point for Primary wave “5”
The SPX chart from October 2020 zooms in on Primary wave “5”
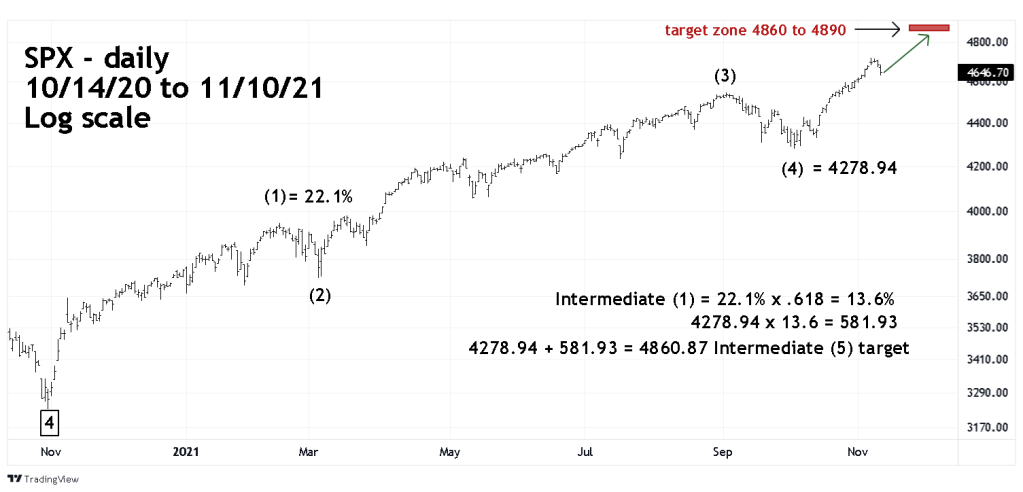
Fibonacci analysis of Elliott sub waves can frequently derive secondary Fibonacci coordinates that can confirm the primary coordinate.
The supposed Intermediate wave (1) of Primary wave “5” had a growth rate of 22.1% from the 10/30/21 bottom. Multiplying 22.1% by the Fibonacci ratio of .618 yields a growth rate of 13.6%. A growth rate from the presumed Intermediate wave (4) bottom of 4278.94 targets SPX 4860.87 for the termination point of Intermediate wave (5).
The two coordinates of 4860.87 and 4889.71 represent what could be powerful resistance. If the SPX rallies into this zone during December 2021 it could be the termination point for the secular bull market that began March 2009.
