Since the S&P 500 (SPX) all-time high on 09/02/21 the decline has been slow. In nearly a month the SPX has only fallen about 5.5%. Today 10/01/21 the SPX broke below the important 09/20/21 bottom. The break came early in the session, and it appeared the trend for the rest of the session could be down. The bulls had other plans and a powerful rally suddenly appeared.
The 2- hour SPX and Russell – 2000 (RUT) chart courtesy of Trading View reveals other potentially bullish action.
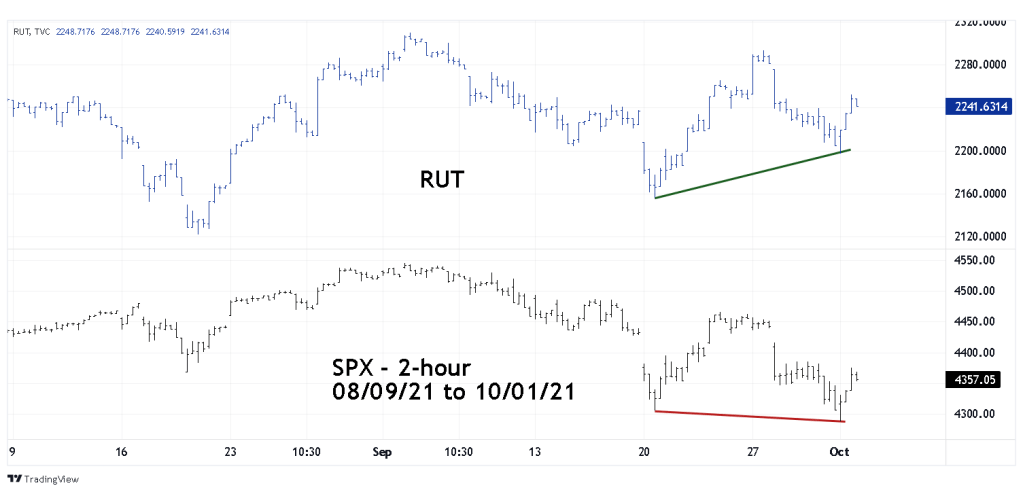
The RUT is composed of small cap companies if a large down trend was developing you would expect these stock to be leading the way down. Small cap companies are weak compared to large cap companies, its logical to expect them to be more vulnerable to an economic downturn. Yet at today’s lows while the SPX broke below the 09/20/21 bottom, RUT held significantly above its respective 09/20/21 bottom.
This is one part of evidence that suggests the decline since 09/02/21 may only be a correction within an ongoing bull market.
If there’s another decline the SPX may only reach the 4150 to 4200 zone. The next blog will illustrate the SPX intraday Elliott wave count and additional evidence the suggests only a correction is underway.
Traders are short 150% non-leveraged SPX related funds. Continue holding short.
