A very effective method to discover support/resistance is by using Point and Figure charts.
A Point-and-Figure (P&F) chart plots price movements for stocks, bonds, commodities, or futures without taking into consideration the passage of time.
P&F charts utilize columns consisting of stacked X’s or O’s, each of which represents a set amount of price movement. The X’s illustrate rising prices, while O’s represent a falling price.
Trading View has an Index – SPX500 – symbol SPX500 which matches the S&P – E-Mini futures trading hours. SPX500 also closely matches the price of the S&P 500 (SPX) stock index. These two feature make SPX500 a good tool to find support/resistance outside of SPX trading hours and relates to SPX price levels.
The SPX500 – 60-minute P&F chart courtesy of Trading View illustrates the action since 02/25/21.
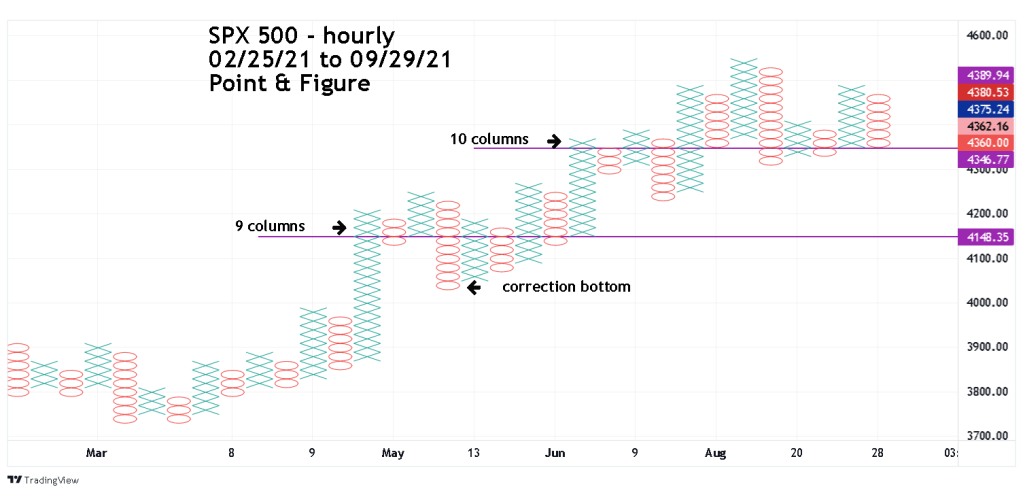
Note that the recent column of O”s ended at 4350 which is the area of action from 9 prior columns. If SPX500 breaks below the bottom it made on 09/28/21 it opens the door to the next largest row of X’s and O’s. This is the 4150 area which corresponds to 9 columns of X’s and O’s.
This implies if there’s another drop, a bottom could be in that area, which corresponds to the broad support zone noted in the prior two blogs.
Sometimes if the maximum area of X’s and O’s does not hold – price could reach the extreme of the support/resistance zone. In this case its 4050 near the SPX500 bottom made on 05/13/21.
The SPX drop from the all-time high on 09/02/21 to the bottom made on 09/20/21 was 11 – trading days. If the current drop from the 09/23/21 peak continues for 11 – trading days, it targets a possible bottom on 10/08/21.
