As of today 09/27/21, the Elliott wave count for the S&P 500 (SPX) is unclear and there’s a possibility a correction bottom was made on 09/20/21. If the decline is still underway its possible that within the next few weeks, the SPX could come down to the area of the May 2021 minor correction. The decline if it happens could be at or near 10% which would be equivalent to the SPX September to October 2020 correction.
The daily SPX chart courtesy of Trading View illustrates the recent action.
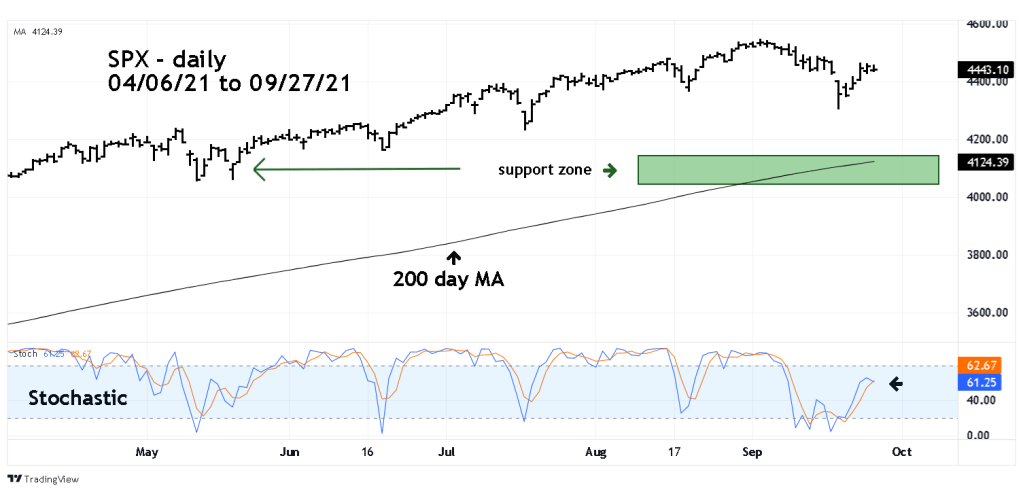
The daily Stochastic bearish crossover in the neutral zone could be signaling the next down wave.
The 200 – day – Moving Average (MA) could become an important factor. I’m doing research on breaks of the SPX – 200 – day MA going back more than twenty – years. If the SPX breaks more than 2% below the 200- day MA, it could be a bear market signal. Depending on market action, more information about the SPX – 200 – day MA will be explained.
