The prior blog noted bullish divergences for New 52 – week lows and Advance/Decline line at the SPX 09/20/21 bottom.
The daily NYSE – New 52 – week lows ($NYLOW) courtesy of Stockcharts.com illustrates this internal stock market indicator.

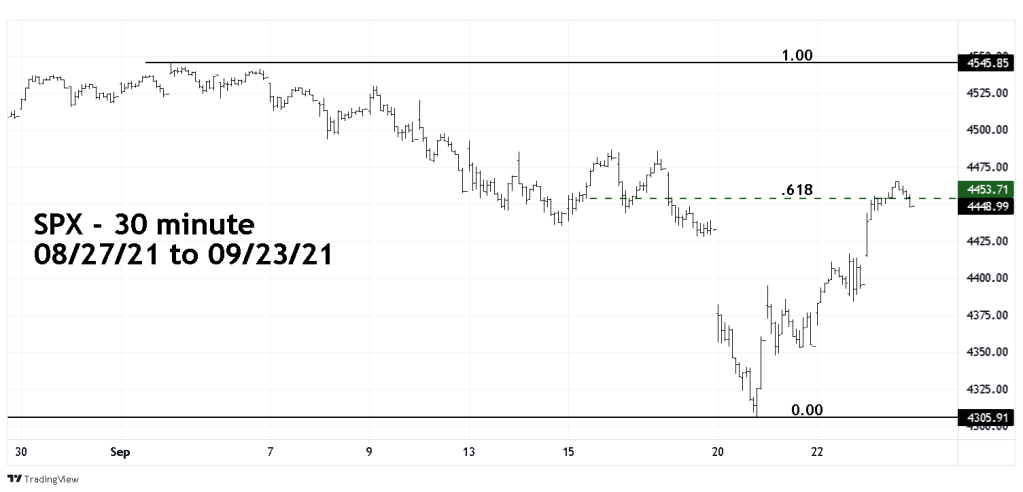
Today 09/23/21 the S&P 500 (SPX) briefly moved above a .618 retracement of the decline from the all-time high – illustrated in the 30 – minute chart courtesy of Trading View.
The combination of bullish divergences and the level of retracement has increased the chances that the SPX decline from 09/02/21 could be just a correction within a broader ongoing bull market.
Traders are short 150% non – leveraged SPX related funds. Lower the stop loss on half of the position on a move above SPX 4545.85.
Lower the stop loss on the second half of the position to a move above SPX 4485.87.
