Since the bull market began on 03/23/20 every S&P 500 (SPX) a multi-day correction bottom has held. The simple definition of a bull market is a series of higher highs and higher lows.
Today 09/20/21 that has changed – the SPX has broken below the last multi-day correction bottom made on 08/19/21.
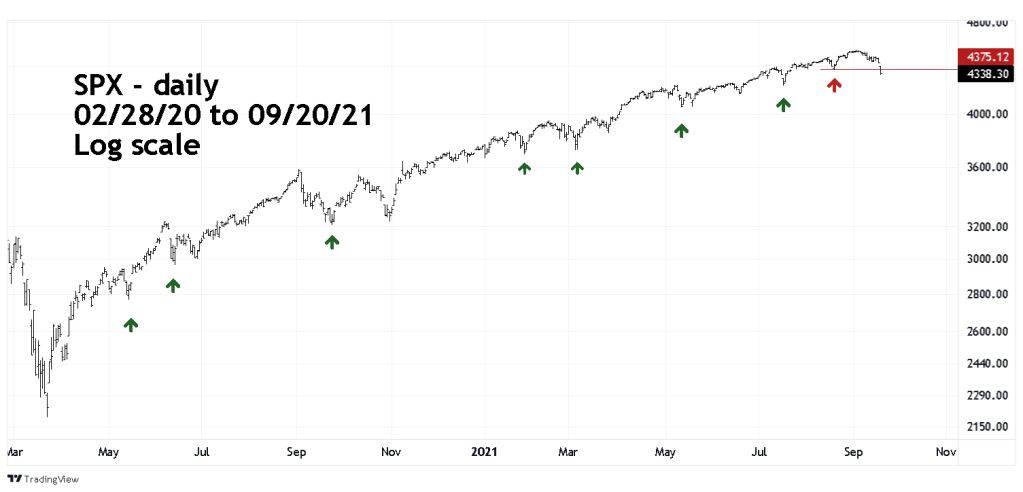
The daily SPX chart courtesy of Trading View illustrates the history of corrections since March 2020.
When something different happens, it could mean an important trend change. This is the first clue that the bull market since 03/23/21 may have ended. If so, it implies at least a multi-month bear market.
Traders are short 150% non-leveraged SPX related funds. Continue holding short.
