Since the S&P 500 (SPX) all-time high on 09/02/21 the decline has been choppy, which is characteristic of Elliott wave corrective patterns. However, part of the drop could be a complex motive wave.
The SPX 30 – minute chart courtesy of Trading View illustrates the short-term Elliott wave count.
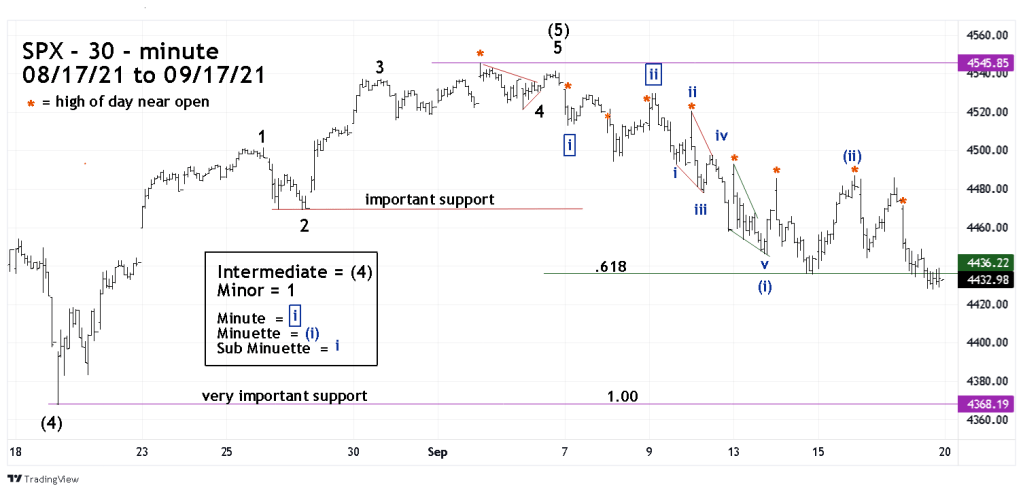
The supposed Minuette wave ( i ) counts as a Leading Diagonal Triangle (LDT), this structure appears in the first wave position of motive structures and in the “A” wave part of corrective patterns. What’s fascinating is that Sub Minuette wave “ i “ of the LDT is an Ending Diagonal Triangle (EDT). This pattern happens in the fifth wave position of motive waves and in the wave “C” part of corrective patterns.
Fibonacci analysis supports this theory. The length of Sub Minuette waves “ i “ through “ iii “ is 51.95 points. Sub Minuette wave “ v “ is almost equal at 52.09 points. Note, Sub Minuette wave “ iii “ is longer than Sub Minuette wave “ i “.
Two other subtle clues imply the main trend is down. Within the last few months there have been instances where important support has been broken, after which the bulls began a new up wave. The 09/10/21 blog noted that important support was broken. The next trading day 09/13/21 it looked like the bulls were starting a new rally as the SPX opened significantly above the prior day closing low. This time the rally failed with the SPX trending down most of the day and breaking below the bottom made on 09/10/21.
The other subtle clue comes from the SPX openings. In bull markets the low of the SPX trading session usually occurs at or near the open of the session. Since the 09/02/21 top, eight of the last twelve trading sessions have seen the high of the trading session near the opening of the day. On 09/16/21 the SPX opened near the high went down, then late in session briefly exceeded the opening high. If you include the 09/16/21 action, shorting the open of the SPX was profitable “day – trade” nine out of twelve times or 75%.
On 09/17/21 the SPX marginally broke below the .618 retracement of the 08/19/21 to 09/02/21 rally. This break is within leeway of the .618 support zone so its possible a near-term bottom could be in place. If on 09/20/21 the SPX were to break below the 09/17/21 bottom it could open the door for a move down to very important support at SPX 4367.73.
Traders are short 150% SPX related non – leveraged funds. Continue holding short.

We’re off the chart!
LikeLike
We may need a bigger chart. There’s a high probability of more downside through at least the end of September.
LikeLike