The current S&P 500 (SPX) bull phase that began in March 2020 has been relentless with only tiny pull backs and only one 10% correction. The last time a similar phenomenon occurred was the SPX bull market from late 1994 to mid – 1996.
The daily SPX chart 1994 to 1996 courtesy of Trading View illustrates the action.
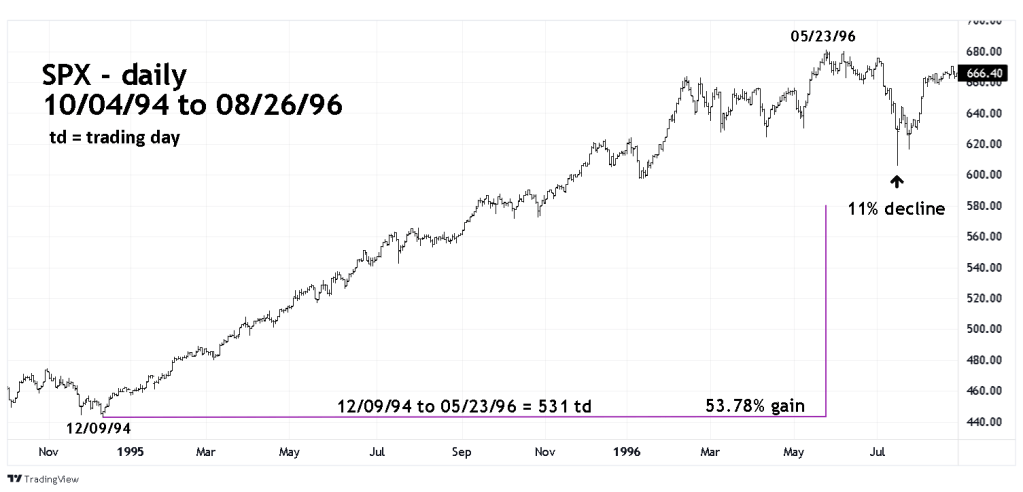
This bull phase was the central portion of a secular bull market that began in late 1990 and continued until early 2000. In Elliott wave terms it was a third of a third wave which in stocks is usually the longest and most powerful of the three motive waves.
The largest correction of the rally was a 5.9% decline from February 1996 to April 1996. The entire bull phase lasted 531 trading days and gained 53.78%.
The daily SPX chart 2020 to 2021 shows the recent bull market.

The move up as of 09/02/21 has gained an astonishing 107.39%. If a new high is made in the next two trading days, it will equal the length of the 1994 to 1996 bull market. The largest correction of the 2020 to 2021 bull market was the 10.5% decline in September 2020. All of the other pull backs, just like in 1994 to 1996 have been tiny.
Could the 2020 to 2021 bull phase be a third of a third Elliott wave like the 1994 to 1996 bull market? Its possible, but highly unlikely. The extraordinary large gain of over 100% in less than two years has rarely occurred.
In the US stock market this phenomenon has only occurred in the mid 1930’s which was the kickoff phase of a mega multi-decade bull market, and In the technology stock sector blow off top from 1999 to early 2000.
Could the 2020 to 2021 bull market be the kickoff phase of an on-going secular bull market that continues for several years? This is also doubtful. As noted in the 04/10/21 blog “Market Resting Time” the one-month bear market prior to the March 2020 bottom was not sufficient rest time.
It most likely the 2020 to 2021 bull move is the blowoff phase of the secular bull market that began in March 2009. If so, the subsequent bear market could continue for several years.
While there could be a nearly perfect match in time of the 1994 to 1996 market to the current bull phase, there could also be a price relationship. The 1994 to 1996 bull market gained 53.78%, multiplied by the Fibonacci number “2” equals 107.56%. The current bull phase gain is 107.39%.
One final note on the time factor, and that’s when the time comparison is occurring. Prior blogs have noted that the final peak prior to the 1929 crash occurred in early September 1929. The final top prior to the 1987 crash happened in late August 1987, and the secondary peak off the SPX double top in 2000 happened in early September 2000.
Because of the persistent trend for the last several months, lunar phases have not provided any trend change signals. When the trend terminates lunar phases can be signposts. For stocks new moons usually indicate tops. There’s a new moon on 09/07/21.
***correction*** There was an error in the data. What was noted as trading days on the chart and in the text should have been noted as calendar days. Apologies for any confusion.
