R.N Elliott wrote that its acceptable to use both logarithmic and arithmetic scale in discovering Elliott wave trend channels. This same theory could also apply to Fibonacci analysis. I’ve noted several times that when there’s a large percentage growth of a market or a stock to use growth rates when examining Fibonacci relationships. Growth comparisons should be the first method to use in large gain situations. Could arithmetic Fibonacci analysis be used in large growth situations? It’s possible especially if it’s confirming a Fibonacci coordinate derived by growth comparisons.
The daily S&P 500 (SPX) chart courtesy of Trading View illustrates the Elliott wave count from 03/23/20 to 07/26/21.
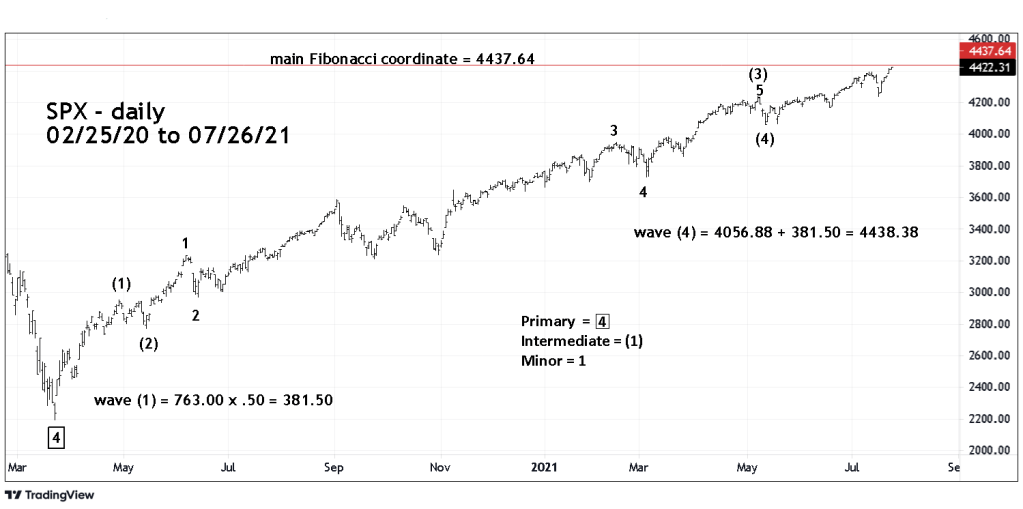
Within a motive wave there’s usually a Fibonacci relationship between waves “one” and “five”
The length of Intermediate wave (1) multiplied by a Fibonacci .50 added to the bottom of Intermediate wave (4) targets 4438.38 very close to the main Fibonacci coordinate of 4437.64. The calculation for the main Fibonacci coordinate can be seen in the 07/05/21 blog “The Next S&P 500 Resistance Level”.
The shorter-term daily SPX chart shows a third Fibonacci coordinate.
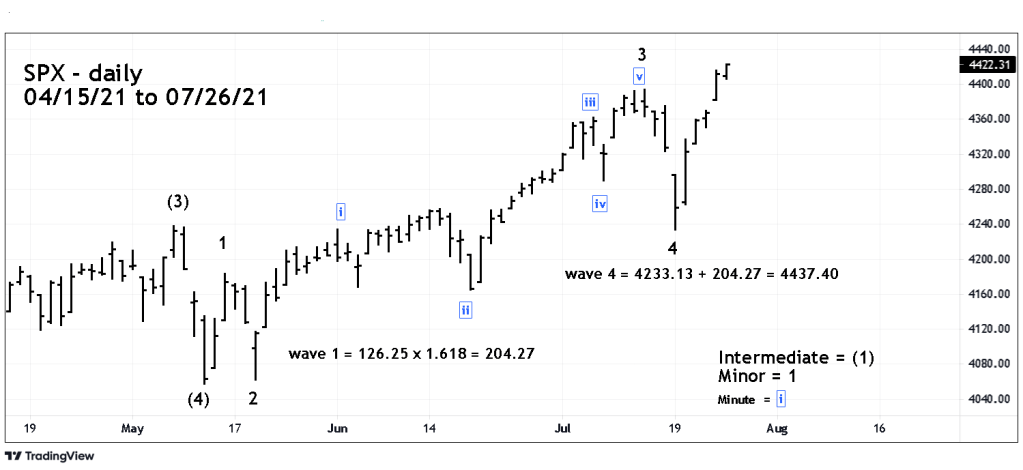
Using the same concept, taking the length of Minor wave 1 multiplied by 1.618 and adding to the Minor wave 4 bottom targets 4437.40.
Three very close Fibonacci points represents potentially powerful resistance. Later this week we could see if this resistance holds.
