After sixteen-months of steadily rising stock prices in which the largest correction was only 10%, complacent bulls probably think it will never end. For analysts that study all four market dimensions, in particular momentum- realize its more like a hidden bear market.
The daily Nasdaq – Advance – Decline Issues ($NAAD) chart courtesy of StockCharts.com illustrates internal momentum.
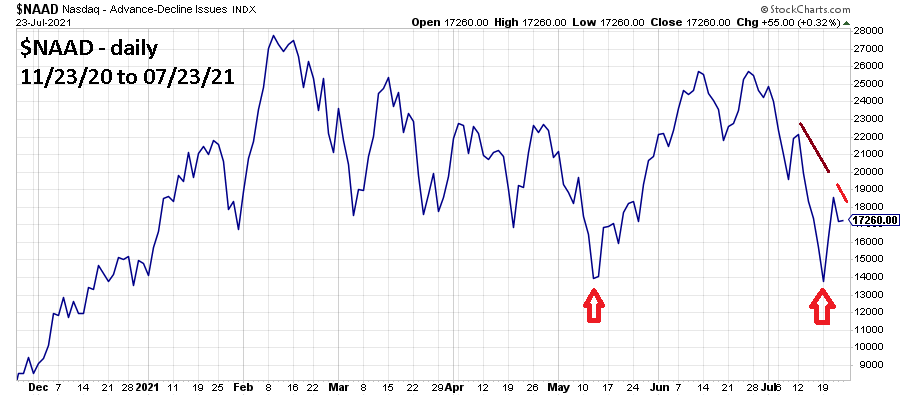
Underneath the surface of the Nasdaq Composite (IXIC) price, $NAAD continues to have a huge bearish divergence. Also note on 07/19/21 $NAAD broke below the low recorded on 05/13/21. This implies the next IXIC decline could at least reach the 05/13/21 bottom, from the 07/23/21 closing level that would be 12% drop.
The daily NYSE- New 52 – Week Highs ($NYHGH) chart updates this momentum indicator.
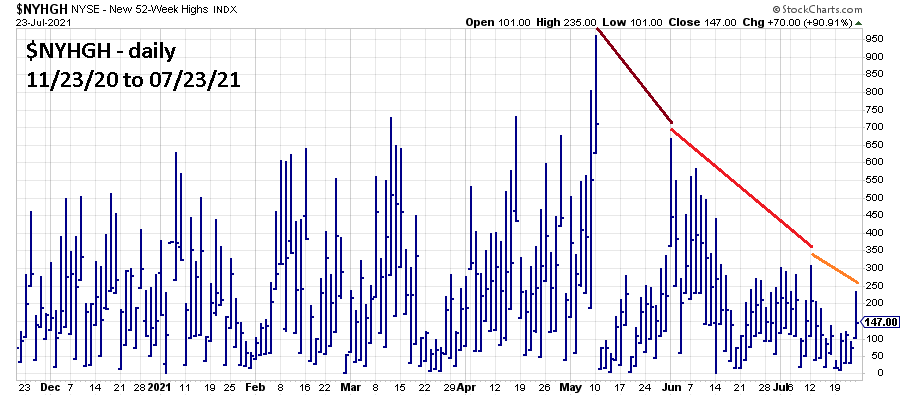
On 07/23/21 with both the S&P 500 (SPX) and the Dow Jones industrial Average (DJI) making new all-time highs – $NYHGH continues to shrink – an incredible bearish divergence.
The daily SPX and VIX chart courtesy of Trading View illustrates short-term sentiment.
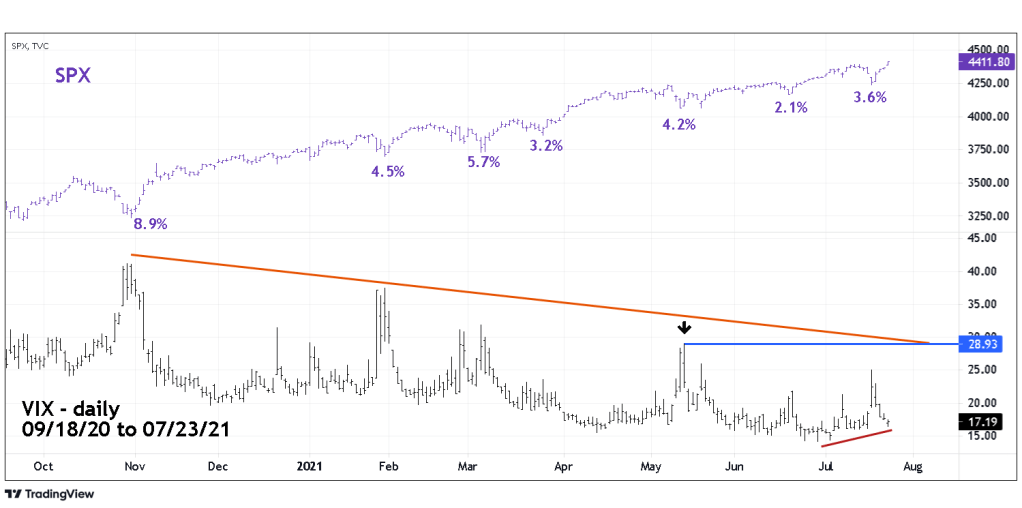
This chart could be called the bullish learning curve. Note as the SPX rises, the size of the corrections has been generally getting smaller. Correspondingly VIX panic spikes have been generally decreasing in size.
The bulls have learned “when stocks decline, buy the dip”.
Also note the VIX has a significantly higher bottom vs. the SPX new all-time high. This is a bearish signal unless the VIX goes below the 14.10 bottom made 06/29/21.
When markets or stocks have significant trend changes, there’re usually signaled by “something different happening”. In this case the something different could be a decline larger than the correction completed on 05/12/21 of 4.2%. If this were to occur, it would be larger not only of the most recent decline of 3.6%, and also the next largest correction.
A VIX move above 28.93 would also be something different.
The daily SPX chart illustrates the next potential resistance zone.
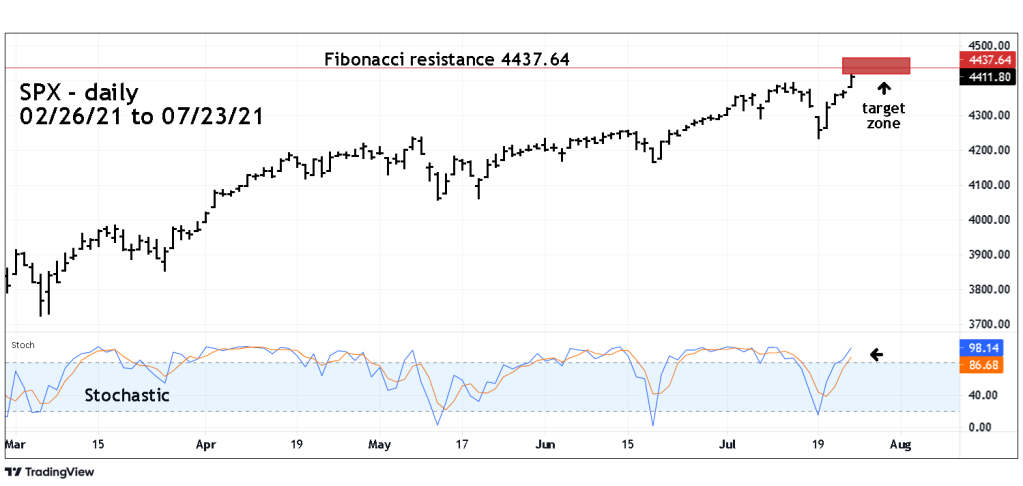
When looking for support/resistance zones also find out where support/resistance could be if the first level fails to hold.
The 07/05/21 blog “The Next S&P 500 Resistance Level” noted SPX 4437.64 could be a Fibonacci resistance level. Subsequent to that blog it appeared the SPX could be topping at a gain of 100% from the 03/23/20 bottom. The exact target was 4383.92 and was a factor in recommending a 100% short on the SPX open 07/12/21. The first stop loss level recommended is on a move above SPX 4470.00 That level was chosen just in case the SPX exceeded the 100% gain level.
Daily Stochastic has reached the overbought zone and gives us a hint that at least a short-term top could be nearby. The angle of the lower Stochastic line suggests additional upside action. It’s also possible the lines could flatten – note the action late June to early July.
On 07/23/21 the SPX, IXIC and, DJI made new all-time highs and is a short-term bullish signal.
If an investors holds only individual stocks in their portfolio, they could be asking; with the market making new highs, why isn’t my portfolio growing? The vast majority of US stocks are probably already in a bear market, the indices are being pushed higher by a few issues. The main stock indices are not yet at the breaking point – they could be, soon.
Traders are short 100% non-leveraged SPX related funds. Continue holding short, use a move above SPX 4470.00 as a stop loss on half of the position.
The extremely bearish momentum is a sign that a major top could be forming.
Several months or years from now, the US stock market could appear to be in a never-ending bear market.
