This sites 7/10/21 post “Momentum Continues to Deteriorate” illustrated the Nasdaq Composite – Advance/Decline line ($NAAD) had bearish momentum divergences. A case can be made that this indicator along with another A/D line are leading US stocks lower.
The daily chart courtesy of Trading View illustrates the NYSE Composite (NYA), S&P 500 (SPX), and Nasdaq Composite (IXIC).

The arrows show recent short-term bottoms for each index.
The next chart shows the daily NYA – A/D line ($NYAD).

During the bull phase that began in March 2020 $NYAD has mostly confirmed price action. On 07/02/21 $NYAD reached its highest level – above the reading made at the NYA price high on 06/10/21 – a bullish divergence.
On 07/16/21 $NYAD went below its reading made at the 06/18/21 bottom – a bearish divergence. The bullish and bearish divergences negate each other, no signal.
The daily chart for the SPX – A/D line ($SPXADP) chart has a different message.

$SPXADP from the March 2020 bottom has also closely followed price action, with a notable exception on 07/14/21 – the SPX all-time high, a bearish divergence. On 07/16/21 $SPXADP went below its reading made at the 07/08/21 micro crash bottom. This signal forecasts the SPX could soon be trading below this important short-term low.
The daily IXIC – A/D line chart – $NAAD has an even more bearish message.
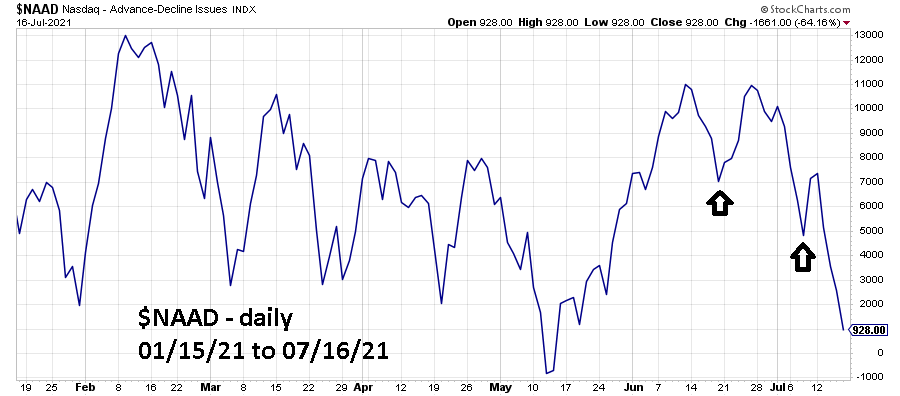
$NAAD has broken decisively below the reading made on 07/08/21, which itself was below the 06/18/21reading! $NAAD is close to going below the 05/13/21 reading. If $NAAD goes below this level it could open the door for IXIC to decline another 8% from its 07/16/21 closing price.
The bearish signals from two out of three A/D lines hint that the NYA, SPX and IXIC could be at the breaking point for a sharp drop.
