There are always alternate Elliott wave counts, the mass mind like an individual mind can change direction. Elliott wave analysts need to be prepared for change and have at least one alternate wave count.
The daily S&P 500 (SPX) chart courtesy of Trading View illustrates the revised Elliott wave count.

The series of three small corrections since the start of 2021 appear to be a series of “fours” and “fives”, they correspond to the series of “ones” and “two” that occurred April to September 2020. Wave “fours” usually terminate within the area of the fourth wave of one lesser degree and that’s what happened in each of the three corrections.
If this wave count is correct and a top is forming at current levels, it would be a penultimate top, followed by another correction, then a final rally to at least a marginal new all-time high. Momentum evidence supports this theory.
On 04/09/21 the daily RSI was 72.17 exceeding the reading of 70.27 made on 01/08/21 which was the first of a double bearish divergence. There’s still a single bearish divergence from the 09/02/20 RSI of 82.90, but the door is open for a potential double divergence in the near future. SPX higher than a potential early April top with RSI reading below 72.17.
There are always alternate Fibonacci support/resistance levels. The daily SPX chart from January 2020 to April 2021 illustrates the next potential Fibonacci resistance level.
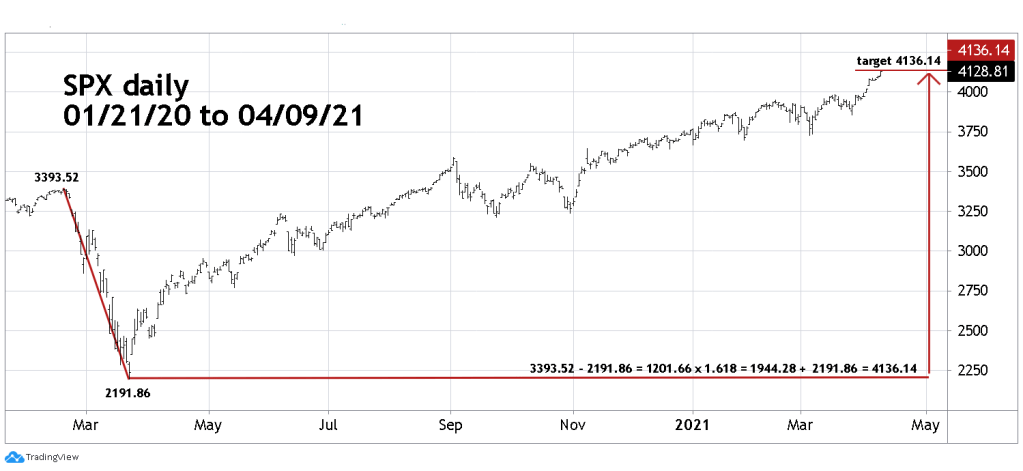
The February to March 2020 SPX crash was 1201.66 points multiplied by the Fibonacci extension of 1.618 equals 1944.28, added to the crash bottom at 2191.86 targets SPX 4136.14. The high on 04/09/21 was 4129.48 and within leeway of the target. Its possible a top was made on 04/09/21.
The SPX daily chart March to April 2021 reveals something interesting.

The rally since 03/25/21 has taken the form of a clear Elliott five- wave impulse pattern. Also, there’s a new moon on 04/12/21. New/Full moons occasionally signal market turns and are especially effective in strong emotional market moves. The powerful rally of the last two weeks qualifies as emotional. I used plus or minus two trading days around new/full moons, the time frame is 04/08/21 to 04/14/21. The emotional market spikes are usually bulls eye hits on a new/full moon. I suspect the SPX could peak on 04/12/21.
Target of Opportunity
This is the bullish evidence.
1) Daily RSI breaks above prior divergent point.
2) On 04/09/21 two of the three main US stock indices – SPX and Dow Jones Industrial Average make new all-time highs. Bullish “Rule of the Majority Signal”.
3) On 04/09/21 daily VIX made a new low in its decline from the March 2020 high. Later there could be for a higher SPX price and a higher VIX bottom. This is the usual VIX to SPX relationship at significant SPX peaks.
Bearish Evidence.
1) Near potentially important Fibonacci resistance.
2) Clear short-term Elliott five wave impulse pattern.
3) Rally into a new moon.
The bullish evidence implies another peak could come in a few weeks. In the near-term there’s a good chance of a decline for a least one-week.
The bearish evidence strongly implies some degree of top could be in place, if not very soon.
On the open of SPX trading 04/12/21 – 9:30 AM – ET short 50% SPX related non leveraged funds. Use a move above SPX 4190.00 as a stop loss on half the position. Use a move above SPX 4210.00 as a stop loss for the other half of the position.
