On 04/09/21 the S&P 500 (SPX) achieved a gain of 88.4% from the 03/23/20 bottom, this is one of the farthest and fastest gains in US stock market history. In 1999 the Nasdaq Composite had a faster and larger move; however, this was primarily because of concentrated buying in the technology sector. You have to go back to the 1930’s Dow Jones Industrial Average (DJI) massive 1932 to 1937 bull market to find a more dynamic broad base rally.
The prior blog “ Powerful Bearish Sentiment Signals” made the case that the current high levels of margin debt and fund in flows implied a major stock peak could be forming. An argument could be made that margin debt and fund inflow could continue rising for months or years fueling a continuing stock bull market. The answer as to why this bullish theory is a low probability is in the dimension of time.
Fibonacci ratios and sequence is prevalent through out nature. The clearest example is the human sleep cycle. The average human requires 8 hours of sleep/rest every 24 hours. 8/24 or 1/3 a Fibonacci ratio. The 16 hours of activity can be extended by stimulants but not indefinitely, at some point you have to sleep.
Now think of a rising stock market as the activity period and falling stock market as the sleep or rest period. Stock markets represent economic growth, and no growth period is indefinite. You can extend the growth period with stimulants but at some point, the economy/stock market will have to rest.
The monthly SPX chart courtesy of Trading View illustrates the last major bear market and subsequent secular bull market.
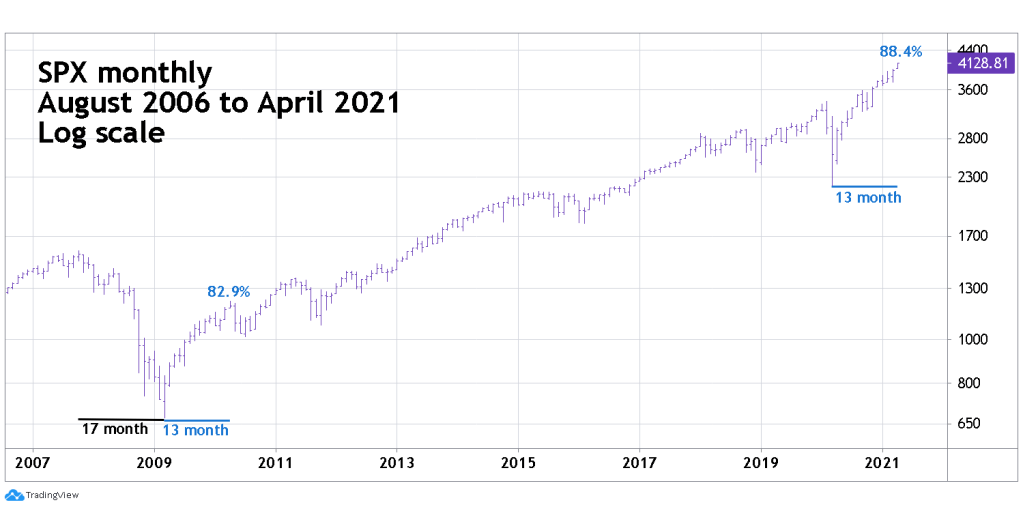
The bear market or rest period was 17 months followed by a 13-month kickoff rally to the secular bull market. The current 13 – month rally began in March 2020 and I believe is blowoff top to the entire secular bull market. It was preceded by 1-month bear market. This is not nearly enough rest period for SPX to continue rising for several months or years. The February to March 2020 crash is most likely just a correction within the secular bull market.
The DJI monthly chart showing the 1929 to 1937 bear and bull phase gives historical perspective.
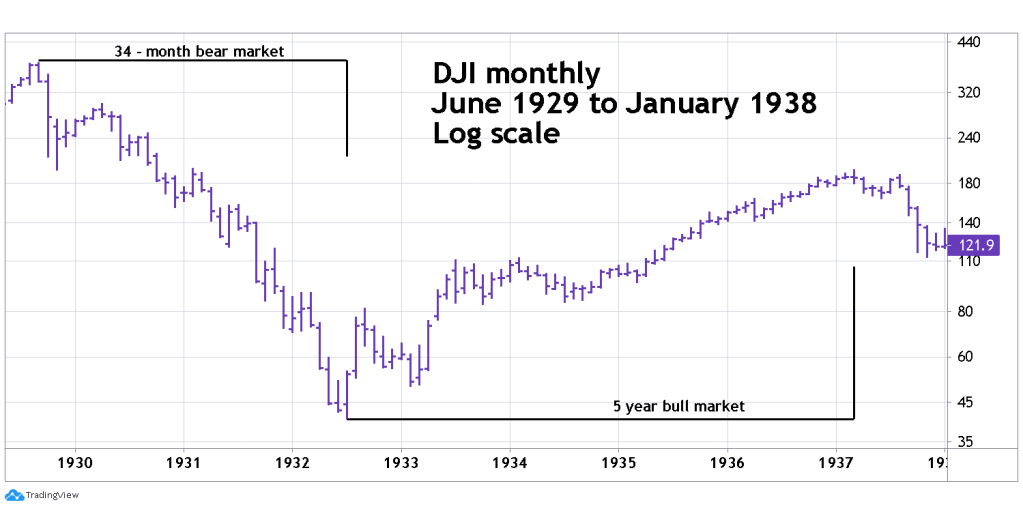
The 34 – month bear market/rest period was followed by the most dynamic bull market in 90 -years. The DJI grew 4.75 times from its bottom made in 1932. Within the 5- year bull market there were two periods in which the DJI rallied mare than 100% in less than a year.
Stock market rest periods unlike humans are not fixed. The subsequent bear market after the DJI top in 1937 lasted 5 – years! The DJI 1973 to 1974 bear market was nearly 2 – years. The DJI 2000 to 2002 bear market was 33 – months.
Anything can happen in the markets, but it’s unlikely a 1 – month crash provided enough rest to sustain a bull market into the latter half of 2021 or beyond.
My 04/11/21 blog will examine what could happen for US stocks in April 2021.

I really enjoy reading your blog. Thank you very much for sharing your thoughts.
LikeLike
You’re welcome. Glad I can help.
LikeLike