The March 2, 2021 blog examined the Bullish Consensus readings for the US stock market over the entire secular bull market that began in March 2009. This update will also examine the recent readings since late 2020.
Market Vane began polling market opinions in 1964. Their Bullish Consensus is the degree of bullish sentiment for a particular market, such as Gold. The Bullish Consensus is compiled by tracking the buy and sell recommendations of leading market advisers and commodity trading advisers relative to a particular market.
The weekly S&P 500 (SPX) courtesy of Trading View illustrates the Market Vane readings since the early 2018 SPX peak.
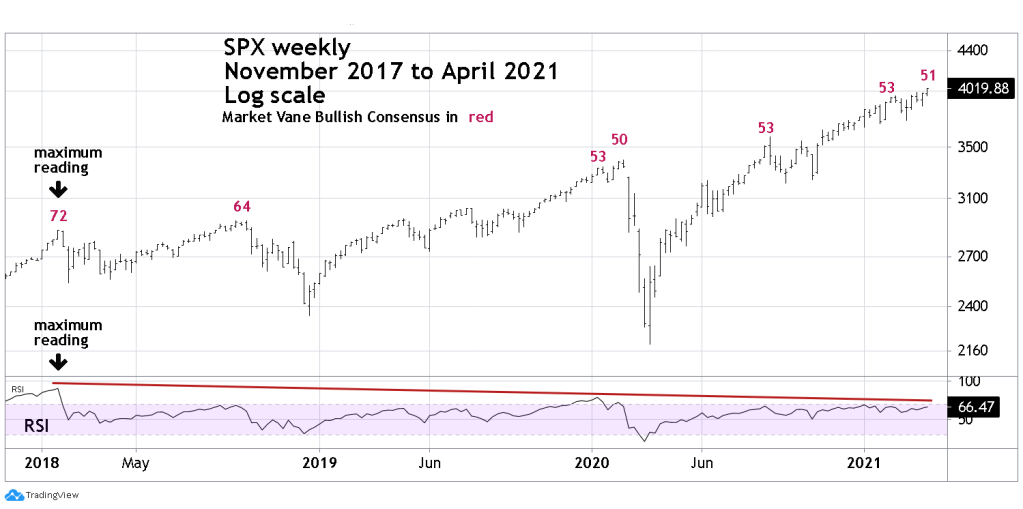
The highest reading of the entire bull market since 2009 was 72% was made in January 2018 which corresponds with the highest weekly RSI momentum reading. Also note that the subsequent SPX tops came on divergent readings, again corresponding to waning momentum.
Note that since early 2020 53% has been a ceiling. Also note the small bearish divergence from the January 2020 reading to the February 2020 reading of 50%. This indicates that market professional polled were getting more bearish, and a signal for a potential decline.
The daily SPX chart zooms in on recent readings.
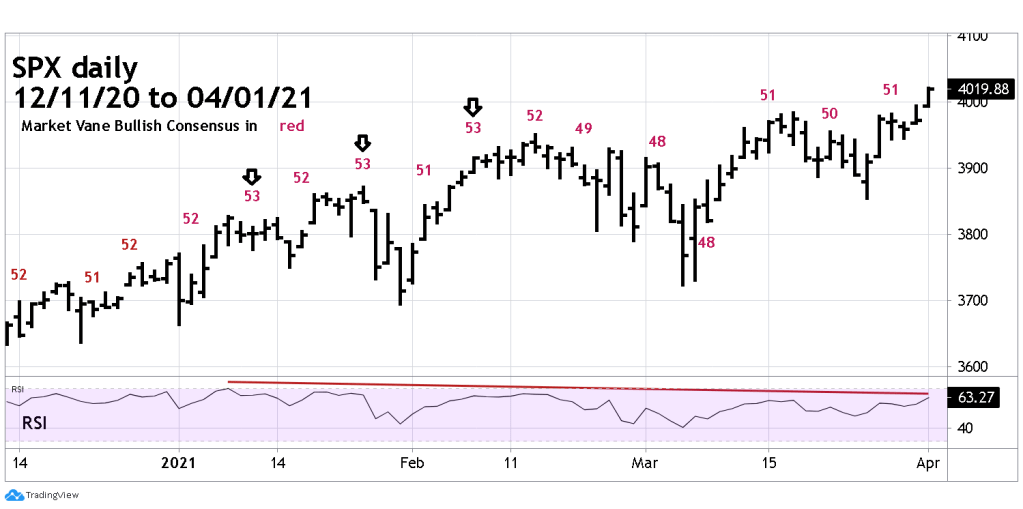
Again, note the occurrence of the 53% ceiling. Also, the continuing divergence with the rising SPX. Daily RSI has the same message as the Weekly RSI, diminishing momentum.
The breakout above SPX 4000 and the rising daily trendline on April 1, 2021 could be viewed by some traders as a bullish signal. Sentiment and momentum indicators have a different message. The correct message could be known in a few trading days.
