If you were to take a poll of Elliott Wave practitioners of what they thought was the most reliable Elliott pattern they would probably say Ending Diagonal Triangle (EDT).
Because of their configuration and location within a larger Elliott wave pattern, EDT’s present an excellent risk/reward trading opportunity. EDTs occur primarily in the fifth wave position when the preceding move has gone as R N Elliott stated, “too far too fast”. On 04/01/21 the S&P 500 (SPX) had rallied 83.4% from its crash bottom made on 03/23/21. This is farther and faster than even the 82.9% gain the SPX made March 2009 to April 2010 – kickoff of the secular bull market. You have to go all the way back to the Dow Jones Industrial Average bull market of the mid – 1930’s to find a more dynamic rally.
The daily SPX chart courtesy of Trading View illustrates the current EDT pattern.
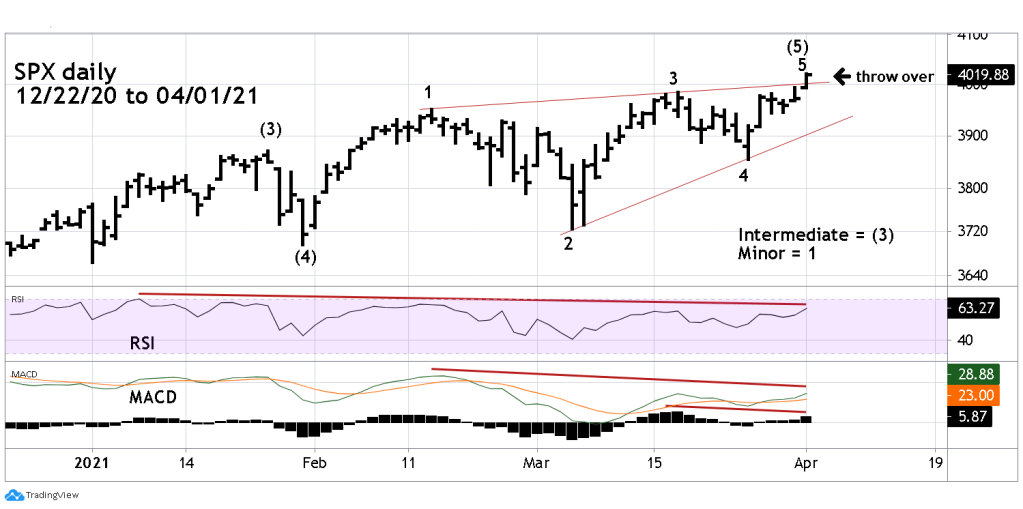
Often the fifth wave of an EDT ends with a “throw over”, a brief break of the trendlines connecting the termination points of waves one and three. This is what occurred on 04/01/21. The trendline break could be a fake out for the traders that lack knowledge of Elliott waves. Additionally, the trendline was at the SPX 4000, a move above this supposed “magic” number could also be viewed as a bullish break out.
SPX 4008 is important Fibonacci resistance. This is the point where the SPX March 2020 April 2021 rally equals the SPX March 2009 to April 2010 rally. There’s always leeway around Fibonacci points. In this case the original coordinates come from more than a decade ago and after a significant percentage gain. Leeway for 4008 could be at least plus or minus 50 SPX points.
The key factor for EDT throw overs is that there’re brief. In this case ideally the SPX should trade below and stay below the trendline as soon as 04/05/21. If the SPX concludes the 04/05/21 session above the trendline it implies something more bullish could be developing.
The daily NYSE new – 52 – week highs ($NYHGH) chart courtesy of Stockcharts.com illustrates internal momentum of the US stock market.
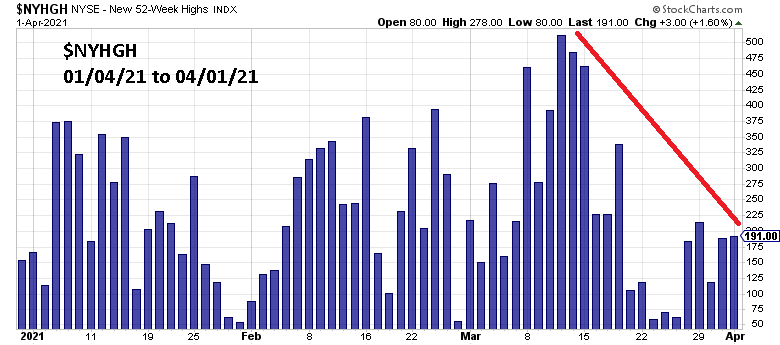
The number of new 52 – week highs recorded on 04/01/21 was anemic, and not what you would expect on a bullish trendline break.
April 5, 2021 could be an important day for the US stock market. If the SPX is trading below the EDT trendline , buyers of stocks on April 1, 2021 could later find they were victims of a market April Fools joke.

Agree 100%. DREW THAT EDT for my members. 😎
LikeLike