On 03/18/21 the Dow Jones Industrial Average made a new all-time high unconfirmed by the other two main US stock indices, S&P 500 (SPX) and Nasdaq Composite (IXIC). I refer to this as a “rule of the majority signal” the market condition is revealed by the non-confirming indices. In this case a bearish signal. Additionally, both the DJI and SPX daily Stochastics had bearish crossovers in the overbought zone. It’s a possibility a significant top for the US stock market was made on 03/18/21. However, one piece of evidence sticks out like a sore thumb – the VIX indicator.
My prior blog noted that on 03/17/21 the SPX made a new all-time high with the VIX making a new one-year low. The VIX chart illustrated four other instances within the last year in which the SPX made a top that corresponded with a higher VIX bottom. The VIX and SPX divergences of last year is not a recent phenomenon, it’s been occurring for several years, with a high probability of being correct. No indicator works 100% of the time, perhaps the recent new VIX low is a rare example of not working. We still need to play the higher probabilities, with four out of four successful divergent signals since early 2020 chances are there could be another.
The daily SPX chart courtesy of Trading View illustrates a possible Elliott wave count allowing for another SPX all-time high.

It’s possible an Elliott wave – Ending Diagonal Triangle (EDT) is forming since the SPX late January bottom. EDTs are a termination pattern that appear in the fifth wave position of motive waves. Typically, the second wave of an EDT has a very deep retracement of the first wave. Usually 70 to 90%, note the deep retracement of the supposed Minor wave “2”.
The SPX 30- minute chart examines the structure in greater detail.
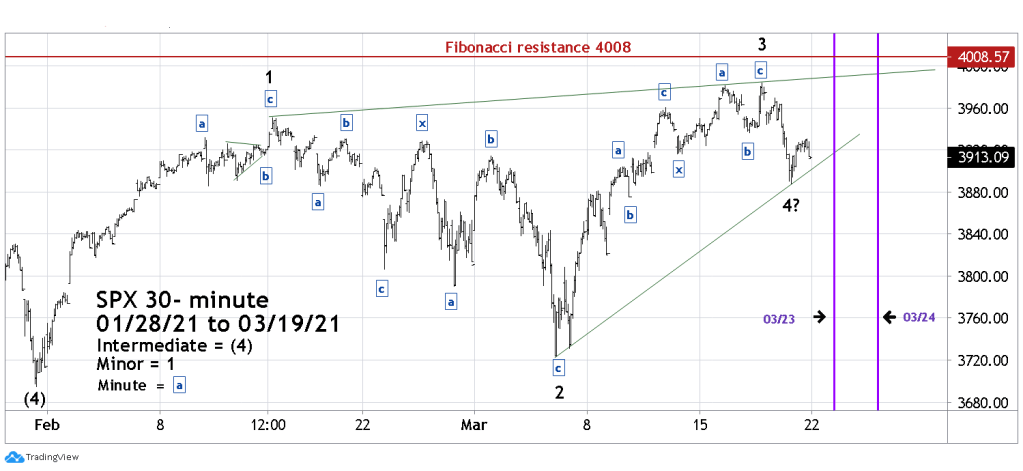
Each sub wave of an EDT subdivide into three-waves or a combination of three-wave patterns. The supposed Minor wave “1” is suspicious because it has the smooth characteristics of five-wave impulse pattern. I’ve learned that sometimes one of the three motive waves within an EDT can appear to be an impulse wave.
The upper half supposed Minor wave “3” has a lot of declines overlapping with the peaks of prior rallies, a characteristic of three wave or in this case a double three pattern.
Very near-term the supposed Minor wave “4” could continue lower. If the wave EDT count is correct, we could see sometime next week at least a marginal new SPX all-time high. March 23rd and 24th are the two most likely days for termination of the EDT wave five.
Also, its common for fifth waves of EDTs to marginally break the trendline connecting the peaks of wave one and three. The ideal scenario would be for a top above the trendline and below the widely watched SPX 4,000. This could fake out the crowd that’s expecting the magic number to be hit. If 4,000 is not hit, they could be waiting for years.

Excellent
To take it a step further,
The idea that SPX 4000 big number crowd target.
is somehow never reached a proverbial key of delusionrests squarely with the crowd.
It’s a wonder that so much psychological big money assumptions
are not the subject of research in higher financial academia today.
LikeLike
Thanks for the imput.
LikeLike
When I first started reading your articles many years back,
you had written about mass psychology in markets and how on rare occasions
that it can change crowd perception about the stock market on a dime.
Perhaps in the future, you can revisit this powerful,and unusual phenomena,
with an updated new article.
LikeLike