Today 03/17/21 the S&P 500 (SPX) and the Dow Jones Industrial Average (DJI) made new all-time highs. When two of the three main US stock indices make new all-time highs it’s a bullish signal.
Also, the VIX made a new low for its movement down from its last major high in March 2020.
The daily VIX chart courtesy of Trading View illustrates its history since December 2019.
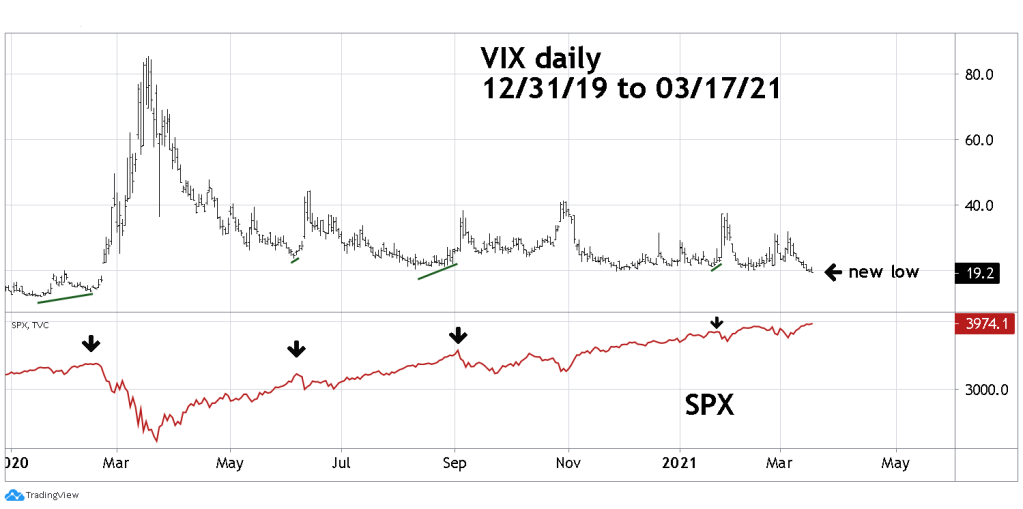
Note that SPX tops come when the VIX is making a higher bottom. Todays, new VIX low is near term bullish for the SPX.
The DJI today may have completed the Ending Diagonal Triangle (EDT) discussed in the prior blog. However, the supposed wave “five” of the pattern was larger in time than the supposed wave “three”. This factor puts the pattern in doubt. If the DJI makes a new high, it will invalidate the EDT pattern.
Only one main US stock index making a new all-time high and VIX with a higher bottom could increase the chances of a top.
The time frame for a one-year solar anniversary of the post-crash bull market is 03/19/21 to 03/25/21.
SPX major Fibonacci resistance is at 4008. The SPX high today was 3983.

How are you positioning your fund at the moment in the light of this complex backdrop? Neutral?
Thanks and good luck!
Sent from my iPhone
LikeLike
Neutral and flat. 25% short position was exited on the SPX 03/12/21 open.
Waiting for an opportunity to short non leveraged SPX related funds.
LikeLike