Today February 12, 2021 the S&P 500 (SPX) may have completed five – Primary waves up from the major bottom made in March 2009.
The daily SPX chart courtesy of Trading View illustrates the prime – Elliott wave count.
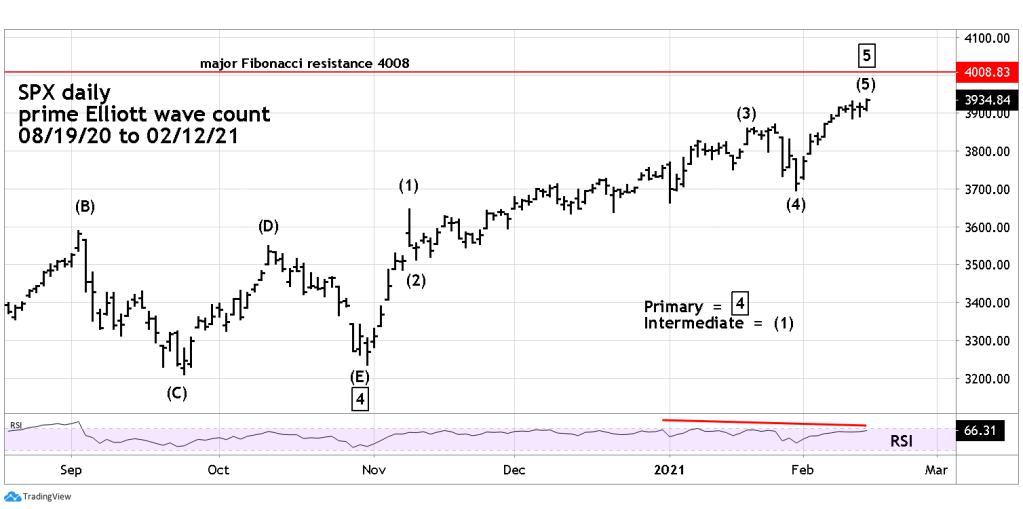
Today’s high came late in the trading session, in what appears to a thrust up after an Elliott wave – Horizontal Triangle from the or SPX high made on February 10th . Its possible this thrust up could continue into the early part of the next trading day – February 15th .
Major Fibonacci SPX resistance is at 4008. This resistance is calculated by taking the growth rate of the SPX March 2009 to April 2010 growth rate of 82.9% and adding it to the SPX March 2020 bottom at 2191. Today’s SPX high was 3937 this is only 1.8% away from the bullseye target of 4008. The coordinates from the resistance target are from twelve – years ago and thousands of SPX points below current levels. This is within leeway for a long-term target.
The next daily SPX chart shows the alternate Elliott wave count.
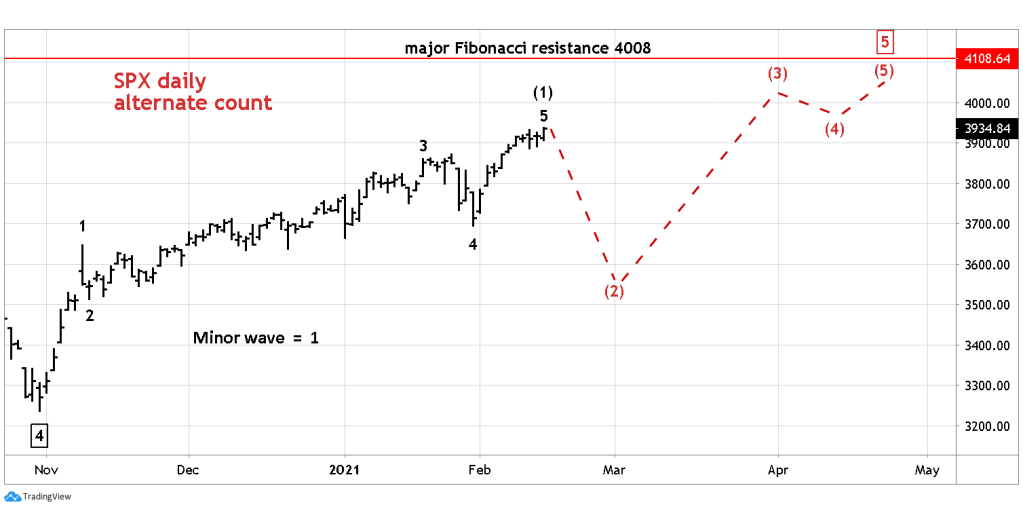
As noted in my February 9, 2021 post “Dow Jones Industrial Average – 55 – Year Anniversary” a problem with the 4008 Fibonacci target is that it’s too close to the obvious 4000 target. Perhaps the SPX could top below 4000. It could also slightly exceed the target to perhaps SPX 4050.
The best alternate count has the rally from October 30, 2020 to February 12, 2021 as just Intermediate wave (1) of a larger developing five – wave pattern.
This possible wave count ties in with broader seasonal patterns, several intermediate peaks have been made late April/ early May since the secular bull market began in March 2009.
This is an exciting time for the US stock market. Evidence is mounting that a major peak could be happening now in February 2021 or perhaps April/May 2021.
More evidence will be illustrated in the next few days.
