On February 9, 1966, the Dow Jones Industrial Average (DJI) reached the climax of a mega 34- year bull market. The peak at DJI 1,000 was not decisively broken for 16- years. Toady February 9, 2021 the DJI made another new all-time high of the secular bull market that began in March 2009. Significant tops in February are rare for the US stock market. There are only two within at least the last 90- years. The 1966 peak and the pre-crash top in 2020. The DJI may have made an important top today. If not, the peak could come in only a few trading days.
The monthly DJI chart courtesy of Trading View illustrates the big picture since the major bottom made in July 1932.

Toady, the DJI may have completed an 89- year Fibonacci – Golden Section with February 1966 as the nexus point. Note the significant bearish monthly RSI.
The daily DJI chart illustrates more recent action.
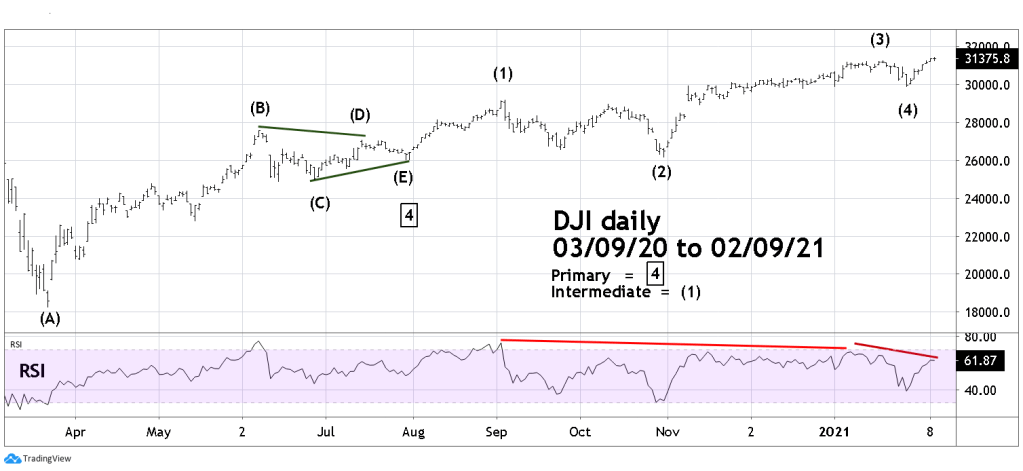
Assuming a primary degree Elliott wave – Horizontal Triangle terminated in late July 2020, all that’s needed is a five – wave motive pattern to complete a post triangle trust. The DJI rally that began January 29, 2021 could be the fifth and final wave.
Note the significant bearish divergence on the daily RSI.
The daily S&P 500 (SPX) chart illustrates the Elliott wave count for that index.
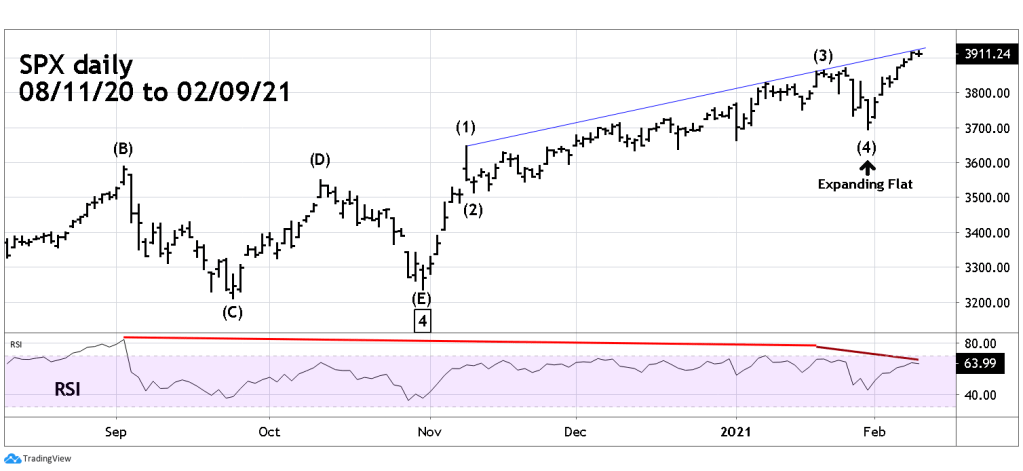
There’s potential major Fibonacci resistance at SPX 4008. This level is calculated from taking the growth rate of the SPX 2009 to 2010 rally of 82.9% and adding it to the March 2020 bottom of 2192.
A problem with 4008 is that its near 4000. The SPX is perhaps the most closely watched stock index in the world. It’s a good guess that there could be a lot of speculation for a top at 4000. Will the market make it easy to catch an important top?
Todays SPX high was 3918 only 2.3% from the bullseye target. This is within leeway for a Fibonacci target that has coordinates going back 11 to 12 years. The SPX is in the zone for what could be an important top.
I thought that the most likely time for a potential major top could be late April to early May, based upon seasonal factors. There have been several intermediate tops April/May since the secular bull market began in March 2009. Now with a five – wave pattern up from the October 30, 2020 nearly complete and near major Fibonacci resistance, a significant peak could be made in mid – February.
A 50% short position on non-leveraged SPX funds was initiated at the open of the main session January 7, 2021. The first stop level at 3900 was reached on February 8, 2021. A 100% position equates to $10,000. The loss on 50% of the 50% short is 1.85%. Continue holding the remaining short position with a stop loss on a break above SPX 3970.

Thank you Mark.
Best Regards, Sheldon Wishnia
>
LikeLike
Glad I can help.
LikeLike