The Dow Jones Transportation Average (DJT) appears to have completed a five – wave Elliott impulse pattern from its 03/23/20 bottom.
The daily DJT chart courtesy of Trading View illustrates the movement.

This is an update to the DJT chart shown in the 10/30/20 post “Dow Jones Transportation Average – An Important Bottom?”. That post correctly identified the DJT minor wave “4” bottom which was evidence for the subsequent 11/02/20 recommendation to go long non-leveraged SPX related funds.
The DJT five-wave pattern appears to have been completed on 01/14/21. The subsequent break below a multi-month rising trendline and move below the prior correction bottom implies at least a minor degree decline is underway.
One of the main tenets of “Dow Theory” is that a divergence top between the Dow Jones Industrial Average (DJI) and the DJT signals a bear market. DJT peak was on 01/14/21 the DJI top was on 01/21/21.
If the rally from March 2020 is complete, it implies at least a multi week drop down to perhaps as low as 9000. However, the bull move from 03/23/20 appears to be just part of a much larger Elliott wave pattern.
The monthly DJT chart examines the bigger picture.
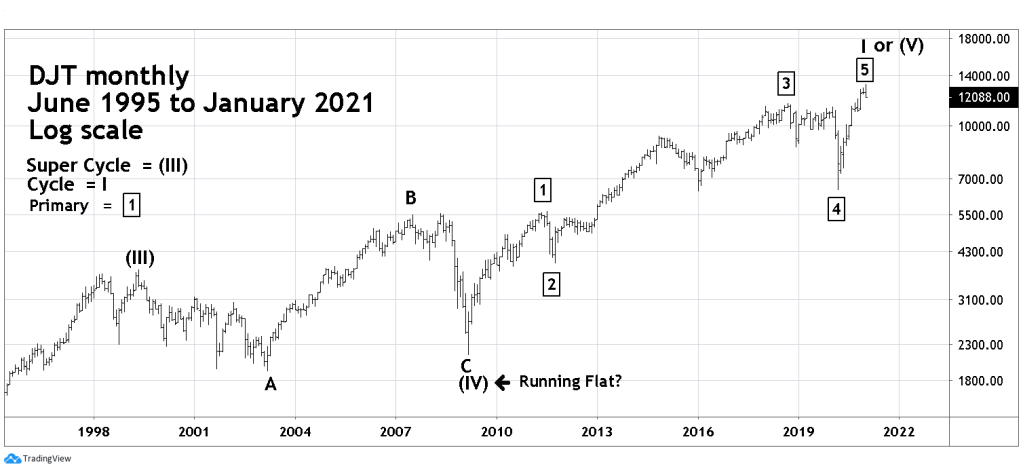
This chart shows that a larger scale five -wave Elliott pattern from March 2009. If this count is correct it implies a multi-year DJT bear market that could decline to the 4,000 area.
Stock market tops are generally slow and spread out. Major peaks could take months to developed. Even if the DJT has reached its ultimate bull market top, other areas of the US stock market could still make new highs. In particular Consumer Staple stocks which was discussed in the 01/19/21 post “Consumer Staples Fund – XLP – Update”.
