Today 01/27/21 the S&P 500 (SPX) broke below chart support made on 01/25/21 and 01/15/21. This is the first time since the rally began on 10/30/20 that the SPX has broken two support levels – powerful evidence that at least a minor decline has begun.
The SPX chart courtesy of Trading View illustrates the daily view.
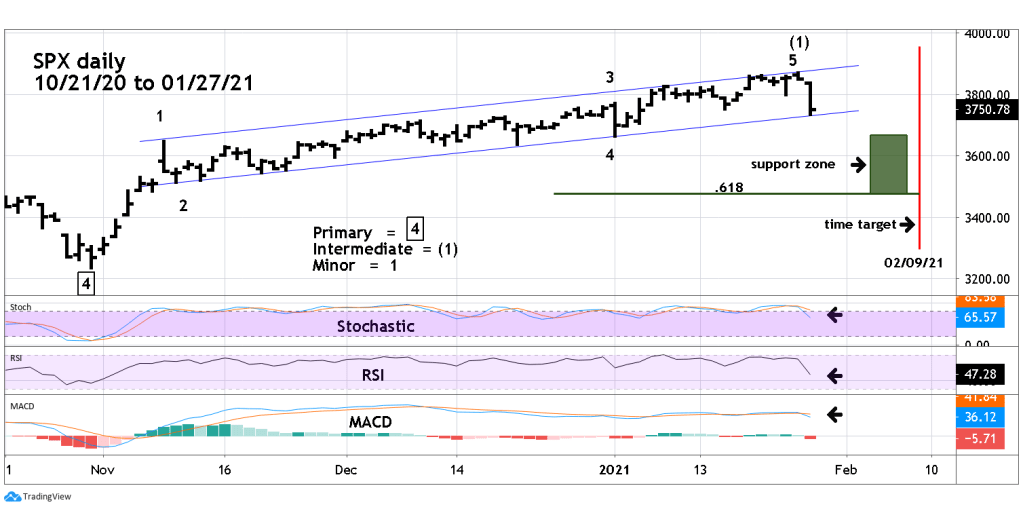
Additional evidence came from momentum indicators. Daily Stochastic and MACD had bearish crossovers. Daily RSI is below the low it made on 01/04/21 while price is still above the bottom made on 01/04/21 – a bearish divergence.
An Elliott five- wave impulse pattern from 10/30/20 appears complete. Fibonacci evidence supports the wave count. Typically wave one will have a Fibonacci relationship with wave five. The most likely relationship is equality. The next most likely relationship is 50%.
Minor wave “1” was 412.06 points x .50 = 206.63 added to the Minor wave “4” bottom 3662.71 targets SPX 3868.74. The actual high on 01/26/21 was 3870.90.
The SPX 30-minute chart illustrates the intraday view.
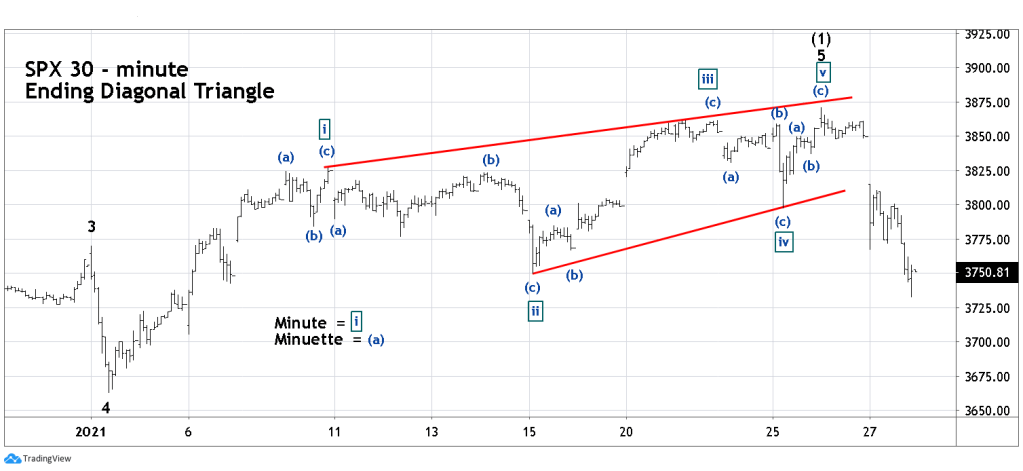
There’s a high probability that Minor wave “5” was an Elliott Wave – Ending Diagonal Triangle (EDT).
Usually after an EDT is complete there’s a rapid retrace back to the EDT point of origin, which in this case is 3662.71. The daily momentum indicators have a lot of room before they become oversold. This implies the more likely downside target could be a .618 retrace of the October to January rally near SPX 3480.00.
The EDT rally from 01/04/21 took about 15 trading days. If the subsequent decline is faster than the rally, perhaps a bottom could be made in 10 trading days after the 01/26/20 top. This targets 02/09/21 as a possible bottom date.
Traders are holding 50% short non – leverage SPX related funds from the 01/07/21 open, Continue holding short.
