The 10/11/20 post “Clearest Elliott Wave Road Map” examined the Consumer Staple- Exchange Traded Fund (XLP) as a guide for timing the broader US stock market. XLP continues to have a clear Elliott Wave count. The decline since the November peak has been slow and shallow, which is the signature of a corrective pattern in an ongoing bull move.
This drop is probably Intermediate wave (4). Wave four declines can find Fibonacci support at two retrace levels: retracement of the third wave, and retracement of the prior three waves. The daily XLP chart courtesy of Trading View illustrates the two potential support zones.
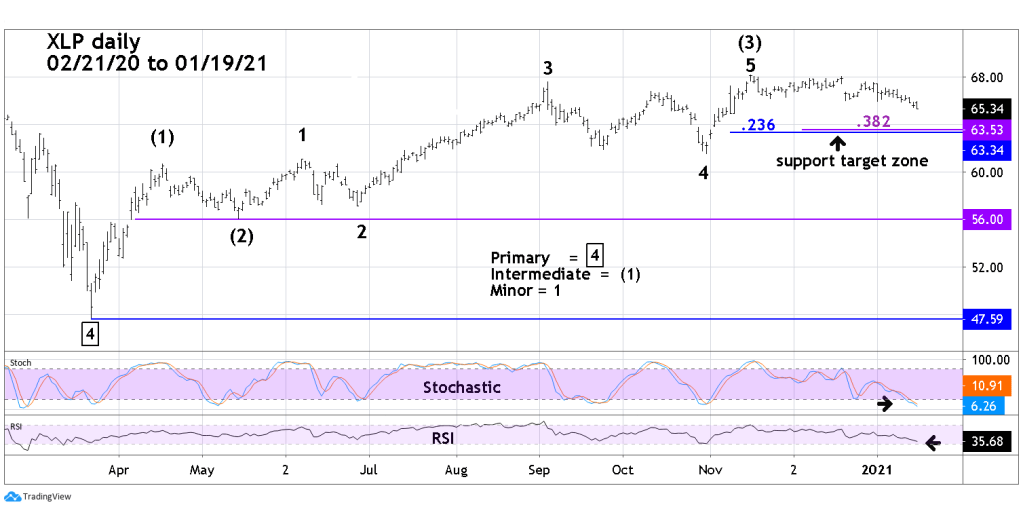
The main Fibonacci coordinate – a .236 retrace of the movement up from the 03/23/20 bottom comes at XLP 63.34. The secondary Fibonacci coordinate – a .382 retrace of the movement up from the 05/14/20 bottom comes at 63.53.
When two or more Fibonacci coordinates are close it usually represents powerful support/resistance.
Also note the daily Stochastic has reached the oversold zone and the daily RSI is close to being oversold. The decline could terminate soon assuming a bottom is not already in place. If a bottom holds the next move up could at least reach the area of the November 2020 high.
The Dow Jones Transportation Average also has a clear Elliott Wave pattern. An update on this index will be issued in a future post.
