The actions of the S&P 500 (SPX) in early 2010 could provide a road map for January to February 2021. The current SPX bull move began in March 2020 which corresponds with the March low in 2009, the rally off that major bottom was powerful and had two peaks, January, and April 2010.
The daily SPX chart courtesy of Trading View illustrates the growth rate and time span of the 2009 to 2010 bull market.

The March to January move was 219 trading days and rose 72.5%. The subsequent minor correction lasted 13 trading days.
Now compare that rally to the current bull move beginning in March 2020.
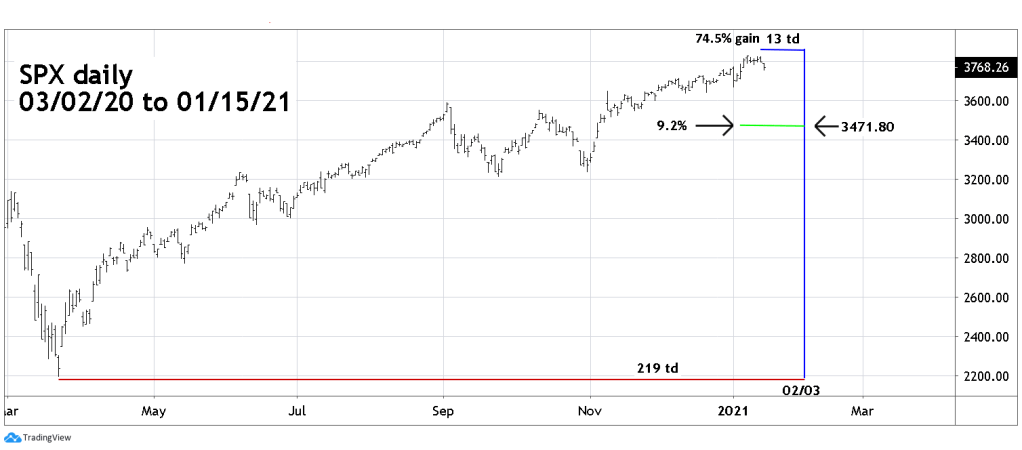
Amazingly the current March to January movement has risen farther and faster than its predecessor. 74.5% vs. 72.5% and in fewer trading days. Putting this mania in a longer-term perspective, you have to go all the way back to the Dow Jones Industrial Average (DJI) rallies in the mid 1930’s to find a stronger bull run.
To make a projection of what could happen next, the SPX slightly lower peak made on 01/14/21 is used instead of the SPX all-time high made on 01/08/21. The reason for this selection is that the DJI and Nasdaq Composite made all-time highs on 01/14/21 – that’s the peak for the bulk of US stocks.
Projecting 13 trading days from 01/14/21 targets 02/03/21 as a possible turn date. Interestingly this equals the same number of trading days – 219 as the 2009 to 2010 rally.
A 9.2% decline comes close to a Fibonacci .618 retracement of the rally from the important 10/30/20 bottom.
The 2010 and 2021 analogy could be a great aid in the next few weeks even if 02/03/21 is not a bottom . Perhaps the SPX continues to climb with 02/03/21 a possible top. A decline larger than 9.2% and/or going beyond 13 trading day could be hint of a larger developing bear move.
Whatever the consequences, keep an open mind and if necessary be prepared to change your opinion.
Traders are 50% short non-leverage SPX related funds from the open of trading on 01/07/21. Continue holding short positions.

Thanks for your usual great insight and right-on-the-mark predictions, Mark. It is especially important to know when to go short and when to stay there.
LikeLike
Thanks for the compliment
LikeLike