Today 10/30/20 the S&P 500 (SPX) made a new low for the decline from its secondary high made on 10/12/20. The Dow Jones Transportation Average (DJT) which made an all-time high on 10/20/20 did not make a new decline low and held above its 10/29/20 bottom. This stronger performance relative to the SPX hints the October decline in US stocks could be just a correction within an ongoing bull market. There’s more evidence.
The daily DJT chart courtesy of Trading View illustrates the Elliott Wave count since the March bottom.
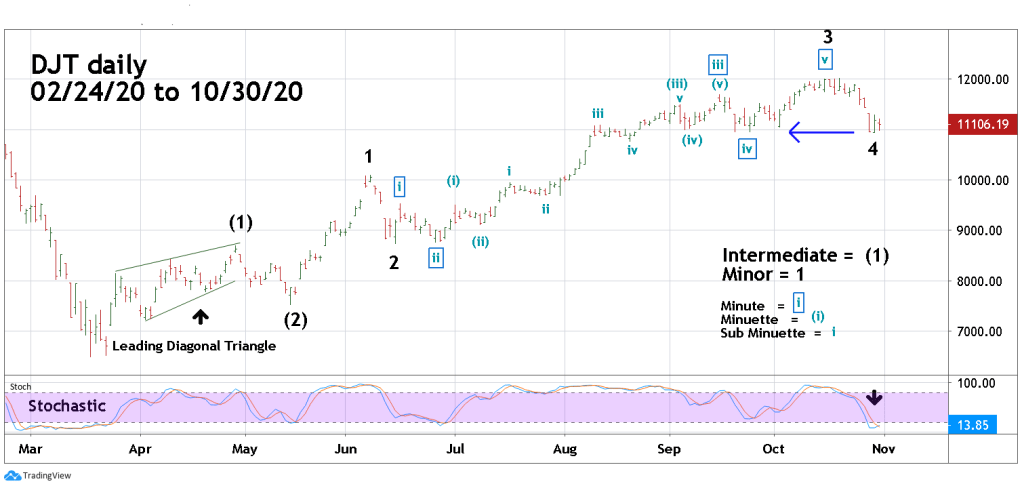
My 10/11/20 post “The Clearest Elliott Wave Road Map” focused on the SPDR – Consumer Staples – exchange traded fund (XLP) noting it could be a guide to tracking the progress of US stocks. We can now also watch the DJT which has a noticeably clear Elliott Wave pattern. The Elliott Wave proportions of the structure from March 2020 are near textbook, and the wave count can be measure down to the Sub Minuette level.
Corrections within Elliott Wave patterns especially if they are wave “fours” will typically end near the area of the fourth wave of one lesser degree. Note the supposed Minor wave “4” has reached near the termination point of the supposed Minute wave “iv” – boxed.
Additional evidence comes from the daily Stochastic which today had a bullish crossover in the oversold zone, this hints the DJT decline may have terminated on 10/29/20.
Keep an eye on the DJT next week, it could be giving additional signals. My next post will focus on the SPX.
