Elliott Wave analysis provides a roadmap of where a market or a stock could potentially be in its cycle. When studying the stock market, the S&P 500 (SPX) because of its large capitalization and following usually has the clearest Elliott Wave patterns. Analysis is enhanced by comparing the wave counts of one stock index vs. another index, fund, or individual stock.
Since the crash bottom in late March 2020 the clearest Elliott Wave patterns for the US stock market are not in the SPX. Nor are they to be found in the other two main US stock indices: Nasdaq Composite and Dow Jones Industrial Average. The best Elliott Wave count is in the SPDR – Consumer Staples – Exchange Traded Fund, symbol (XLP)
XLP is illustrated in the daily chart courtesy of Trading View.

In any bull cycle XLP is usually one of the strongest of the eleven SPDR sector funds, the companies within the fund produce or distribute essential consumer items. The current top three holding in XLP are: Procter & Gamble, Walmart, and Coca-Cola.
Each of the sub waves are distinctive and the size proportions are within Elliott Wave guidelines. If this count is correct a five-wave pattern could be complete in early 2021.
On a scale of confidence from one to ten, with ten being the highest, I rate the XLP pattern a nine.
The daily SPX wave pattern from March 2020 illustrated in the next chart is a different story.
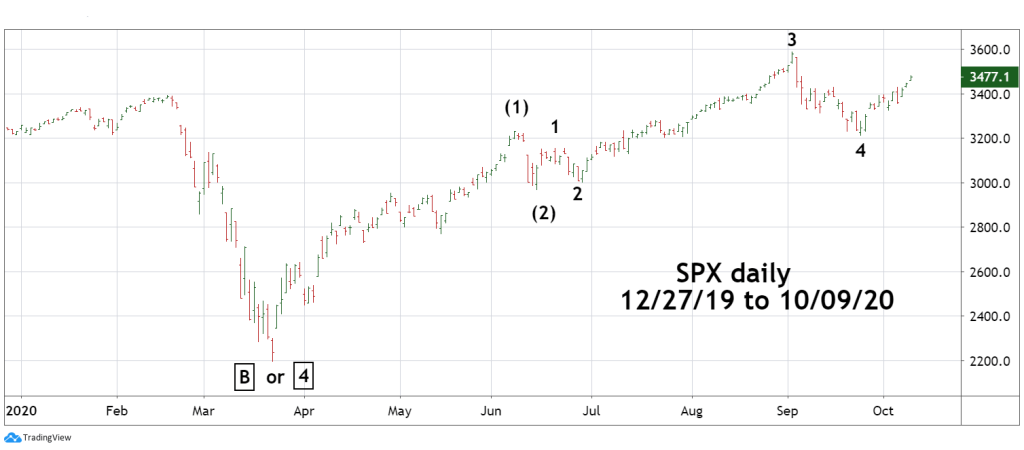
This is just one of several alternate wave counts that could explain the actions from the March 2020 bottom.
The concerns with this wave count are as follows:
- The supposed Minor wave “4” retraces .64 of the supposed Minor wave “3” rally. Most wave “fours” retrace .236 to .382 of wave “threes.
- The proportion of the supposed Minor wave “4” is much larger than the supposed higher degree Intermediate wave (2).
- The subdivision of the supposed Intermediate wave (1) are not clear.
On a scale of one to ten, I rate the SPX wave count a six.
The XLP is now the roadmap for the progress of US stocks. Future posts will show both the XLP and SPX. If the XLP wave count is correct, it could help timing what could be an important peak for the US and global stock markets.

What good news! I was just thinking that XLP would be a good investment in these pandemic times. Thanks so much for verifying my hunches, Mark. Of course, you do this scientifically, which is a lot more useful than playing a hunch.
LikeLike
Glad I can help.
LikeLike
Quite amazing insights.
So well done that I have to read it over again.
LikeLike
Thanks for the compliment.
LikeLike