The bulls continue to be in control of US stocks. The 10/06/20 blog post noted the S&P 500 (SPX) could bottom 10/07/20. The SPX opened that day significantly above the 10/06/20 close and was the low of the 10/07 trading session.
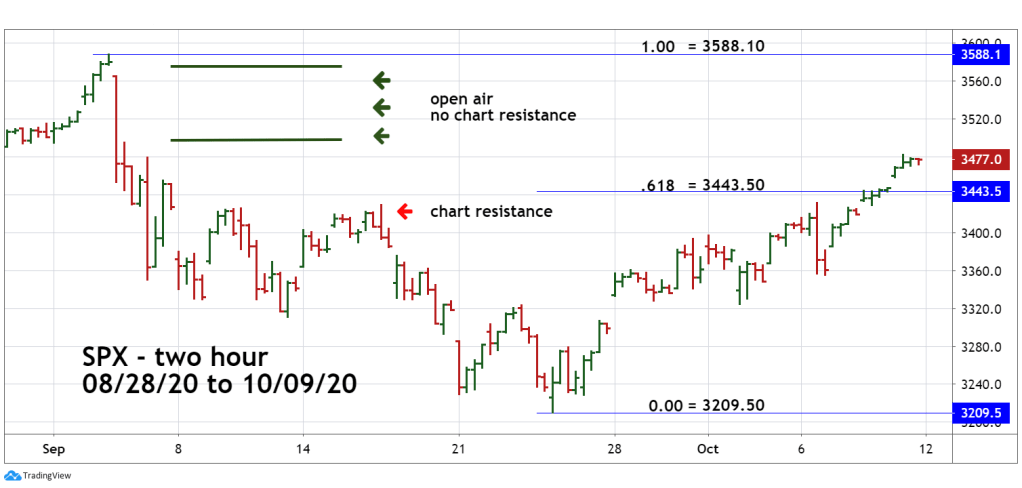
On 10/06/20 SPX broke above important chart resistance made on 09/16/20. On 10/08/20 SPX broke above Fibonacci resistance at 3443.50 which was a .618 retrace of the 09/02/20 to 09/24/20 decline. The next Fibonacci resistance level is in the area of the all-time high at 3588.10 which is a 1/1 retrace.
Note on the SPX – two-hour chart courtesy of Trading View, there’s no chart resistance until the high of 3588.10. This implies there could be a steady rally over at least the next several trading days.
Additional evidence of the bullish breakout comes from the Market Profile method which illustrates trading volume relative to price levels. For example, if the greatest volume of the trading day occurred at a price of 150 it would represent the longest volume bar.
The next chart courtesy of Ninja Trader illustrates the Volume Profile for the S&P 500 – 12/20 E-Mini on 10/09/20.
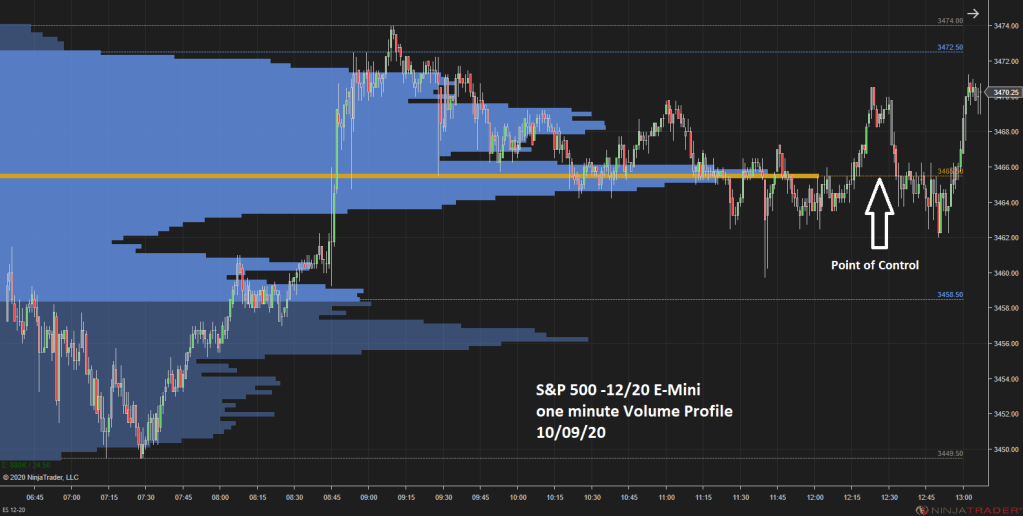
The heaviest trading volume for this day occurred at the price of 3465.50 which is called Point of Control (POC). Price gravitates either towards or away from POC.
The following two-hour chart for the 12/20 E-Mini (ESZ) illustrates the market profile for each trading session from 08/25 to 10/09.
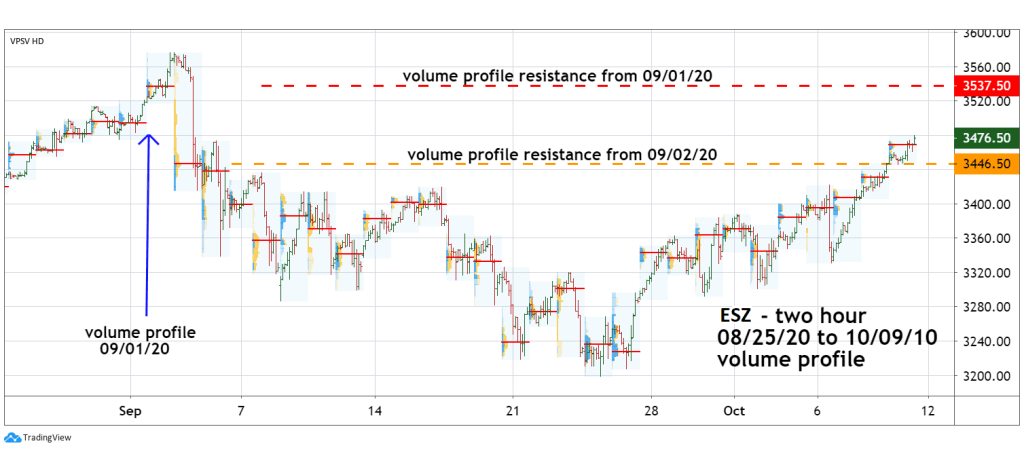
On 10/09 ESZ broke above the most current POC resistance point made on 09/02/20 at 3446.50. This opens the door for ESZ to be drawn to the next most current POC resistance level made on 9/01/20 at 3537.50, close to the all-time high.
Traders are long non-leveraged SPX related funds at the 10/07 opening SPX price of 3384.60. A recommendation to add to the position will be made if a low risk opportunity occurs.
The next post will focus on the Elliott Wave structure for the US stock market.
