The PHLX Semiconductor index (SOX) was the subject of the 11/09/25 blog “The Leading U.S. Stock Sector – Part – Two”. In late October 2025 – SOX made an all-time high with weekly RSI deep in the overbought zone and at its highest level since the bull move began in April 2025.
Normally stocks and stock indices make their ultimate peaks with at least one RSI bearish divergence. The 11/09/25 blog speculated that a SOX peak could come in December 2025. SOX continued to climb after December 2025 and peaked in late February 2026. Now in April 2026 – SOX has made another all-time high.
The weekly SOX chart courtesy of Trading View updates the action.
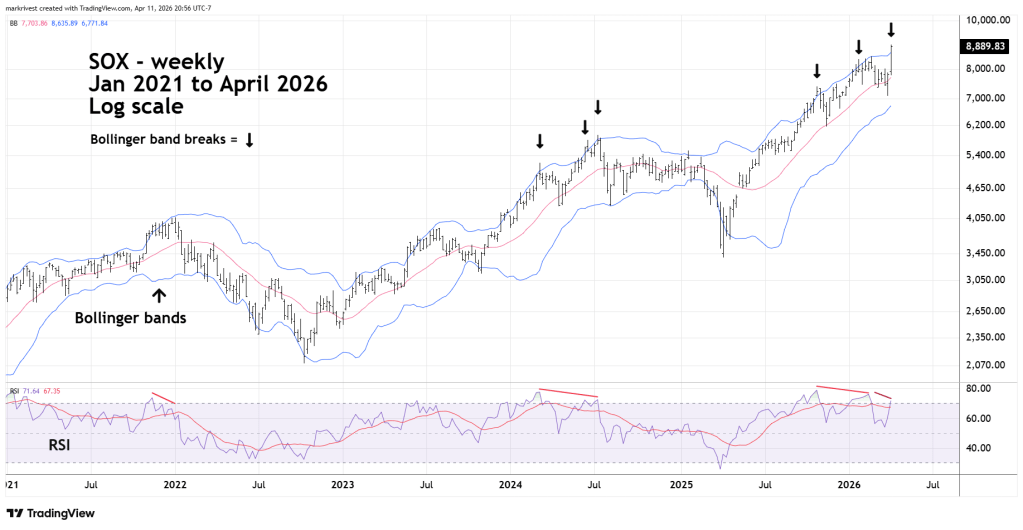
The most significant point on the chart is the double bearish RSI divergence. Also note the spikes above the upper Bollinger band since early 2024. These spikes imply price rally exhaustion. The RSI bearish divergences and price spikes strongly suggest SOX could soon begin another decline.
Additionally, the SOX all-time high is unconfirmed by almost all other stock indices.
S&P 500, Dow Jones Industrial Average, and Nasdaq are all below their respective all-time highs. Outside of the U.S., no other major national stock index is at an all-time high. None of the so call “Magnificent Seven” stocks are at new highs.
Only the Dow Jones Transportation Average and the Dow Jone Utility Average have made new highs.
Closely related to the SOX is the Technology Sector – ETF (XLK).
The weekly SOX and XLK charts show their relationship.
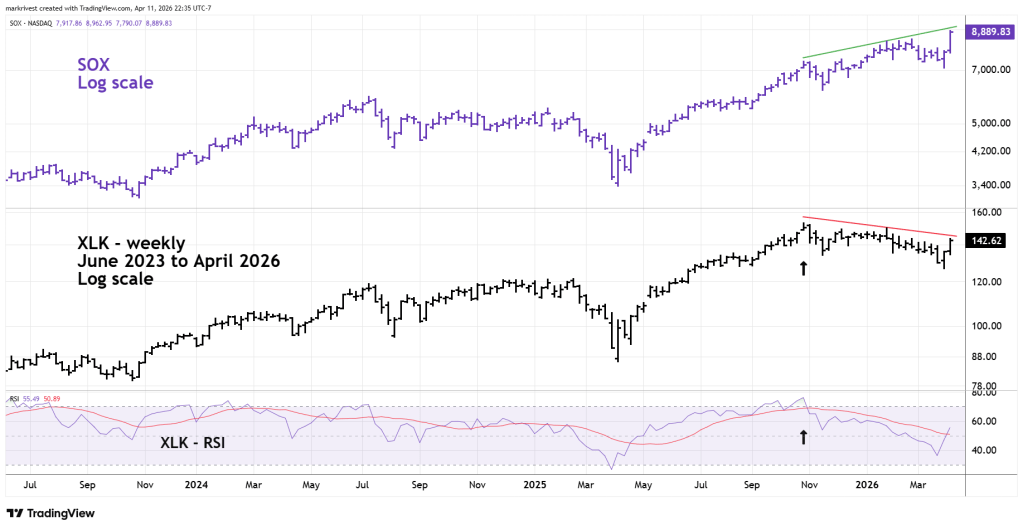
Surprisingly even the XLK is not keeping pace with SOX.
However, a case could be made that XLK has started a rally to new heights. Please note that at the XLK late October 2025 all-time high occurred with RSI at its maximum level. Perhaps in several weeks XLK could reach another all-time high with a bearish RSI divergence.
If this happens it could be part of a broader stock market rally.
We could have more evidence in a few days; it depends on breaking above significant resistance noted in this website prior two blogs.
