The prior blog noted that S&P 500 ($SPX) had strong resistance in the 6,850 to 6,900 area. On 04/10/26 $SPX moved marginally higher and reached 6,845.77. This could be a significant peak, if not, a peak could be reached in the next one or two trading days.
The daily $SPX chart courtesy of StockCharts.com updates the momentum readings.
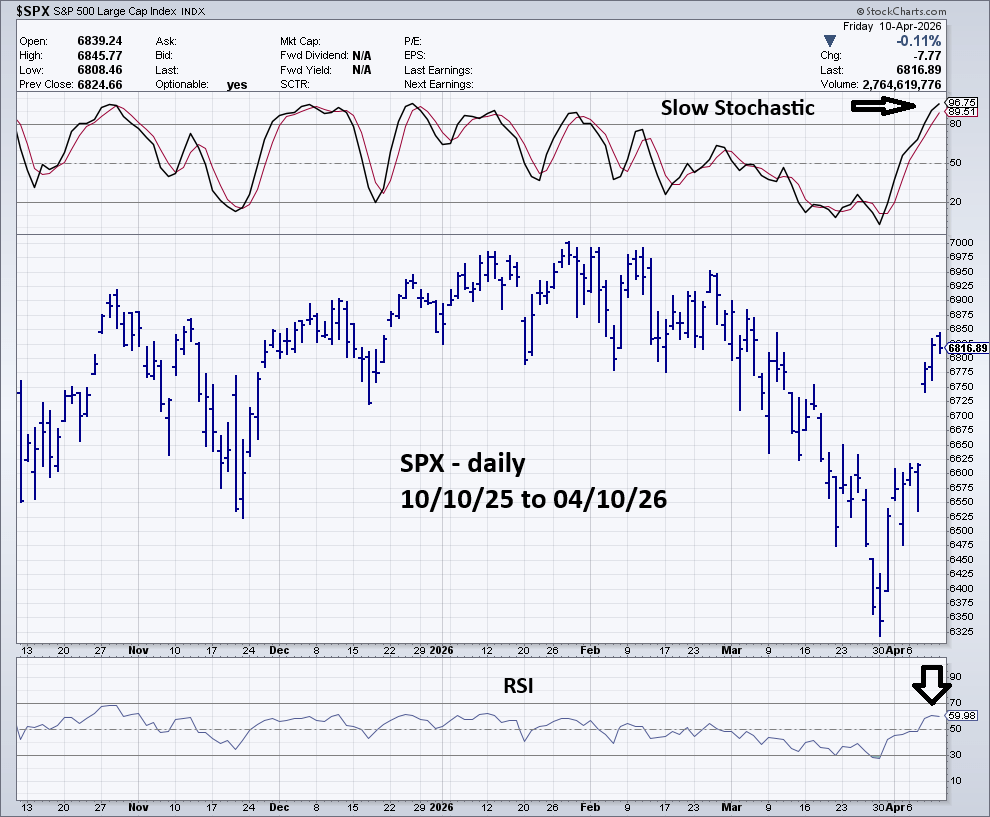
Both lines of the Slow Stochastic are deep in the overbought zone above 80.00 indicating a price peak could be imminent. Alternatively, sometime Stochastic indicators can flatten out for several days. Please note what happened from early to mid – December 2025. The price peak took several days to form before there was a decline.
Daily RSI on 04/10/26 was 59, below the overbought zone of 70.00. An important price peak can form with the RSI below the overbought zone. The $SPX all-time high on 01/28/26 was made with a daily RSI reading of 58.00.
The strongest evidence of a peak forming at current levels comes from the price dimension.
The 04/09/26 blog illustrated a $SPX daily Point & Figure chart showing resistance in the $SPX 6,850 to 6,900 range.
Examining a lower time scale and a different index provides additional evidence.
The 30 – minute June 2026 – Micro S&P 500 futures (MES) – Point & Figure chart courtesy of Trading View narrows the perspective.
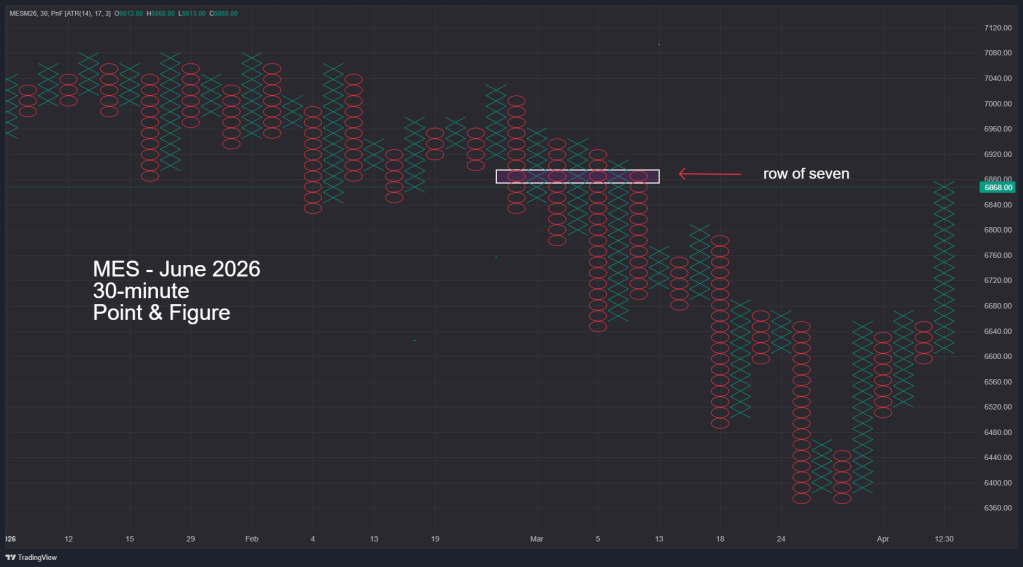
On 04/10/26 – MES reached its potential resistance zone.
If an important peak has not been made on 04/10/26, it could be made on 04/13/26 or 04/14/26.
