Weekly S&P 500 (SPX) momentum oscillators point to an approaching bottom.
The weekly SPX chart courtesy of StockCharts.com illustrates the action since 2021.
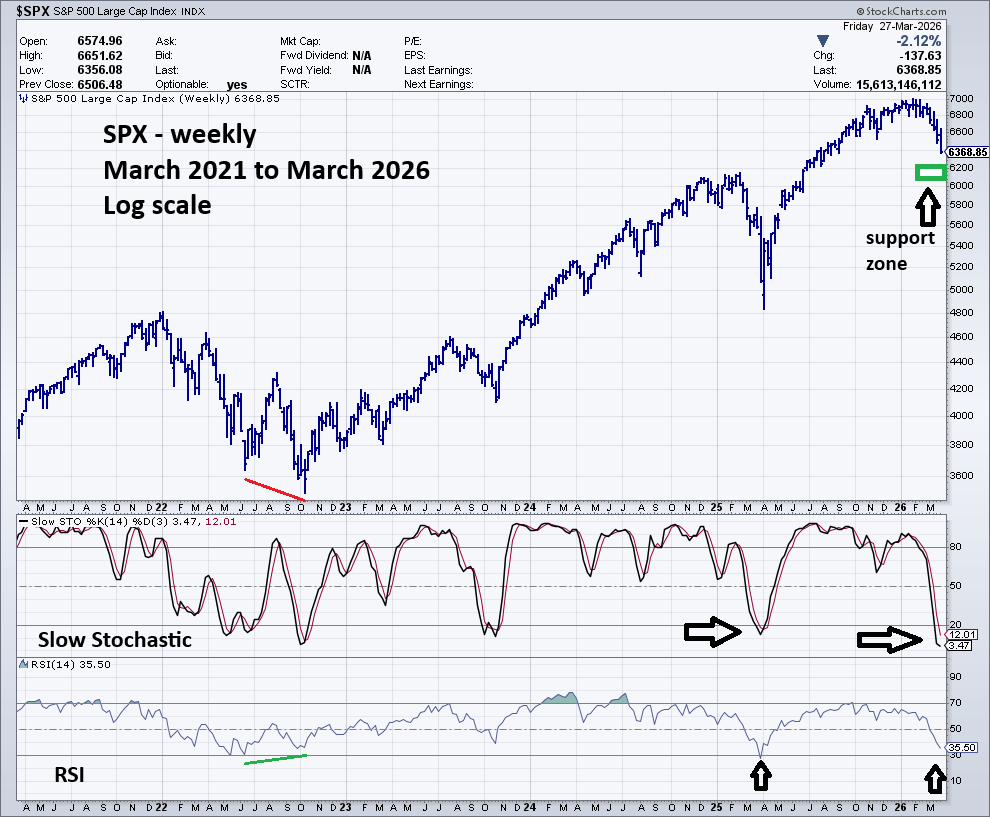
The weekly Slow Stochastic has already gone below the level achieved at the April 2025 bottom and is the second most oversold reading in five – years. A case could be made that an important bottom was made at the 04/27/26 low.
However, weekly RSI does not support that theory. As of the week ending 4/27/26 the weekly RSI was 35.50, above the reading of 27.65 made at the April 2025 bottom.
Even if weekly RSI went below the oversold boundary at 30.00 it could indicate a penultimate bottom. Please note that the ultimate SPX bottom in October 2022 had a significant RSI bullish divergence vs. the reading made in June 2022.
The time zone for the next potential bottom is 04/02/26 to 04/10/26. There’s a Full Moon on 04/02/26. Sometimes market can turn on Full/New Moons plus or minus two trading days.
Another interesting date is 04/07/26 which is the one-year anniversary of the SPX April 2025 bottom.
The prior blog “Resistance at the 200 – Day Moving Average – March 2026” noted a potential support zone in the SPX 6,120 to 6,220 area.
Events in the Iran war could trigger a panic spike below 6,120 to 6,220.
The next blog will examine other possible support zones below 6,100.
