The prior blog “Near the S&P 500 – 200 – Day Moving Average” noted, “Using the SPX – 200 – day SMA with daily RSI and potential Fibonacci support could identify at least a short- term bottom sometime in the next two weeks”.
The support zone was 6,550 to 6,470. On 03/20/26 the S&P 500 (SPX) bottomed out at 6,473.52.
The daily SPX chart courtesy of Trading View updates the action.
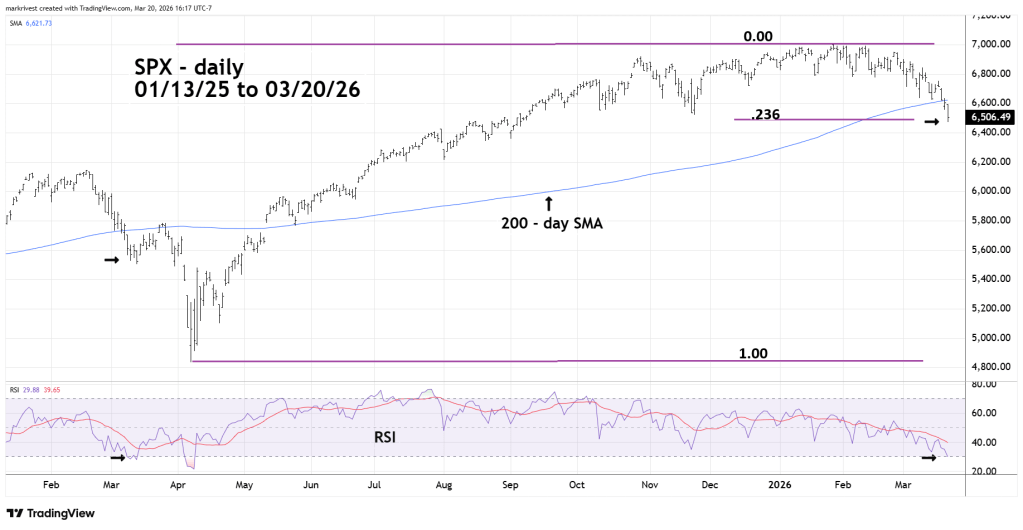
Daily RSI on 03/20/26 was 29.88. The oversold zone boundary is 30.00. The price bottom on 03/20/26 was just below a Fibonacci .236 retracement of the April 2025 to January 2026 rally.
The SPX is now in a similar situation to the short-term bottom made in mid – March 2025.
The next important test is a reaction to the SPX – 200 – day Simple Moving Average (SMA). A failure to break above the 200 – day SMA could open the door for another multi- week decline.
