Last week Crude Oil spiked up over 30%. Long-term analysis puts this move in perspective.
The monthly continuous futures chart – Trading View symbol “CL2!” illustrates the action back to 2006.
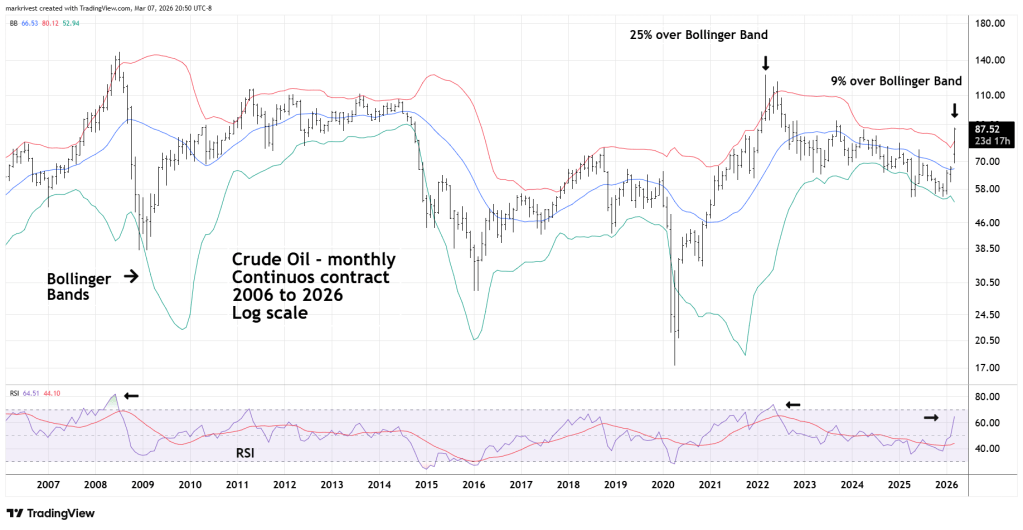
During early 2022 price went 25% above the upper Bollinger Band. Currently Crude Oil is only 9% above the upper Bollinger Band.
In 2008 monthly RSI reached 81%. In 2022 RSI was 73%. So far monthly RSI has yet to reach the overbought zone which begins at 70.00 and is now at 64%.
The next monthly Crude Oil chart shows what happened in 1990 when Sadam Hussein invaded Kuwait.
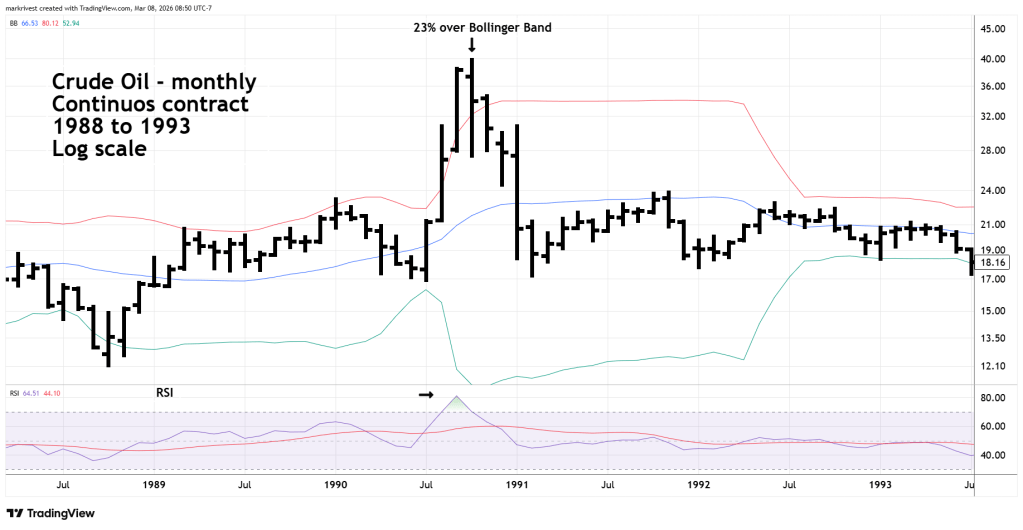
Price went 23% above the upper Bollinger Band and RSI reached 81%.
Last week Crude Oil went parabolic and could continue rising for at least two weeks.
There’s a price cluster from 99.00 to 108.00 made from March to July 2022 that could be a resistance zone.
