Since mid – December 2025 the S&P 500 (SPX) has been in a narrow choppy range, frustrating both bulls and bears. If the bears can break through nearby support, it could drop SPX to a more significant support zone.
The daily SPX chart courtesy of StockCharts.com illustrates three momentum oscillators.
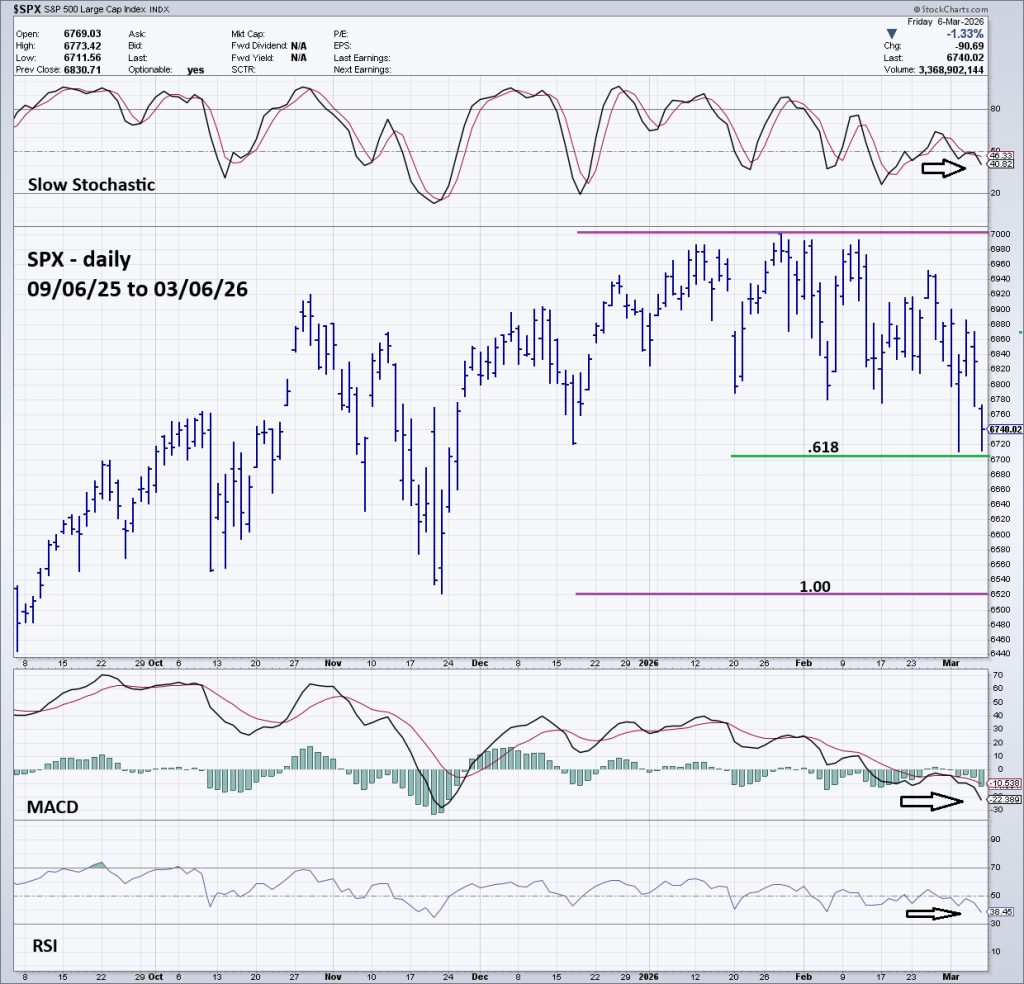
On 12/17/25, 03/03/26, and 03/06/26 the SPX bottomed just above the Fibonacci .618 retracement of the November 2025 to January rally.
Evidence from three momentum oscillators suggests there could be enough fuel to punch through the Fibonacci .618 level.
Slow Stochastic lines are in the middle of the neutral zone and still far from the oversold zone which begins at 20.00.
RSI is at 38% and its oversold zone begins at 30%.
MACD is trending down and is above the levels it reached during the November 2025 decline.
Based on momentum evidence, if the SPX can break below the Fibonacci .618 level, price could move down to the 11/21/25 bottom.
The next daily SPX chart courtesy of Trading View shows a longer – term Fibonacci retracement level.
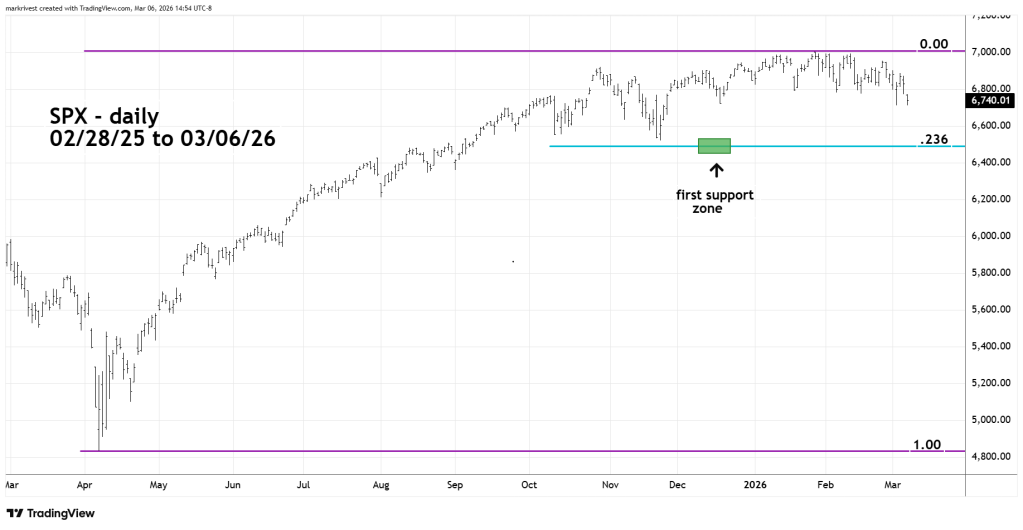
The Fibonacci .236 retracement of the April 2025 to January 2026 rally is just below the November 2025 bottom. A larger scale Fibonacci retracement level close to a prior bottom or peak implies strong support/resistance. In this case strong support.
If the SPX trends down, there’s a good chance a bottom could be made in the 6,550 to 6,470 area.
Caution, if the SPX makes a bottom in this zone, it may only be a pause in a larger developing decline. So far, the largest correction of the post April 2025 rally has been 5% – this was the November 2025 decline. A decline from January 2026 peak to the 6,550 to 6,470 area would be about 6% to 7%.
Normally minor declines in stock index bull moves are about 10%.
