Nvidia Corporation (NVDA) in 2025 was one of the most bullish U.S. stocks. From April to October 2025, it gained 145%. Since its all-time high in October 2025, it has failed to keep pace with the U.S. stock bull market. Is this just a small correction in an on going NVDA bull move, or the start of a larger decline?
The bullish scenario depends on near – term support levels holding.
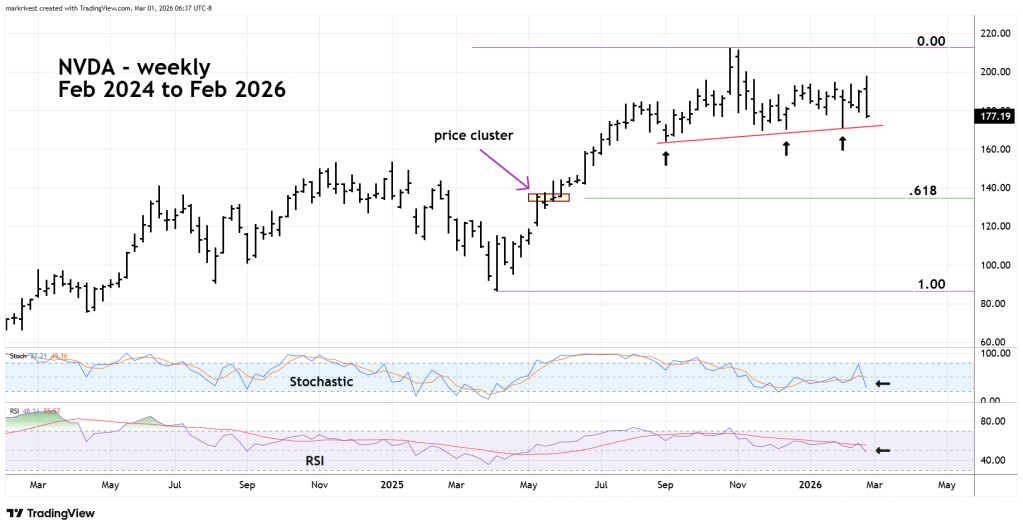
The weekly NVDA chart courtesy of Trading View illustrates the long – term picture.
The rising trendline from the September 2025 bottom could be the key. A break below this line could trigger a selling sequence that punches through the following bottoms.
February 2026 bottom at 171.03.
December 2025 bottom at 170.31.
September 2025 bottom at 164.07.
If these dominos fall the next significant support is in the 135.00 area near a Fibonacci .618 retracement of the April to October bull move. This retracement level corresponds with a price cluster created from May to June 2025.
Weekly Stochastic and RSI support the theory that prices could continue declining. Stochastic has been trending down and both lines are still above the oversold zone, which begins at 20.00.
RSI is also trending lower and is far from its oversold zone, which begins at 30.00.
Watch the rising trendline from September 2025.
